Original Link: https://www.anandtech.com/show/6107/corsair-force-series-gs-240gb-review
SandForce TRIM Issue & Corsair Force Series GS (240GB) Review
by Kristian Vättö on November 22, 2012 1:00 PM ESTIntroduction to the TRIM Issue
TRIM in SandForce based SSDs has always been trickier than with other SSDs due to the fact that SandForce's way to deal with data is a lot more complicated. Instead of just writing the data to the NAND as other SSDs do, SandForce employs a real-time compression and de-duplication engine. When even your basic design is a lot more complex, there is a higher chance that something will go wrong. When other SSDs receive a TRIM command, they can simply clean the blocks with invalid data and that's it. SandForce, on the other hand, has to check if the data is used by something else (i.e. thanks to de-duplication). You don't want your SSD to erase data that can be crucial to your system's stability, do you?
As we have shown in dozens of reviews, TRIM doesn't work properly when dealing with incompressible data. It never has. That means when the drive is filled and tortured with incompressible data, it's put to a state where even TRIM does not fully restore performance. Since even Intel's own proprietary firmware didn't fix this, I believe the problem is so deep in the design that there is just no way to completely fix it. However, the TRIM issue we are dealing with today has nothing to do with incompressible data: now TRIM doesn't work properly with compressible data either.
Testing TRIM: It's Broken
SandForce doesn't behave normally when we put it through our torture test with compressible data. While other SSDs experience a slowdown in write speed, SandForce's write speed remains the same but read speed degrades instead. Below is an HD Tach graph of 240GB Corsair Force GS, which was first filled with compressible data and then peppered with compressible 4KB random writes (100% LBA space, QD=32):

And for comparison, here is the same HD Tach graph ran on a secure erased Force GS:
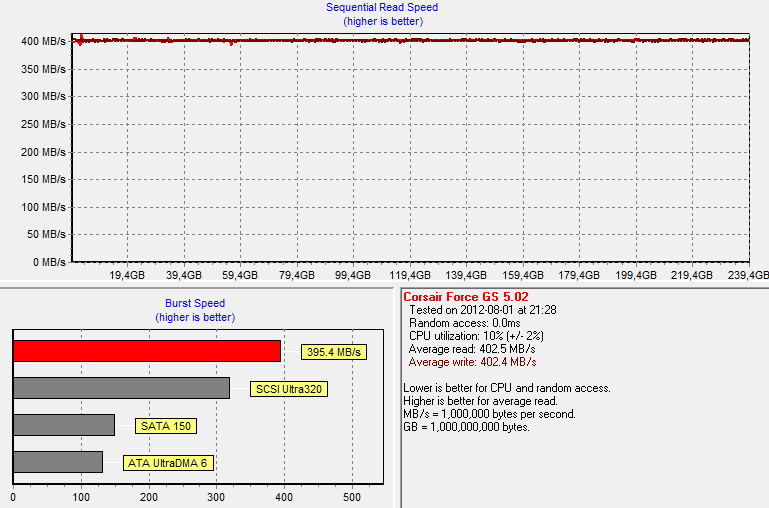
As you can see, write speed wasn't affected at all by the torture. However, read performance degraded by more than 50% from 402MB/s to 182MB/s. That is actually quite odd because reading from NAND is a far simpler process: You simply keep applying voltages until you get the desired outcome. There is no read-modify-write scheme, which is the reason why write speed degrades in the first place. We don't know the exact reason why read speed degrades in SandForce based SSDs but once again, it seems to be the way it was designed. My guess is that the degradation has something to do with how the data is decompressed but most likely there is something much more complicated in here.
Read speed degradation is not the real problem, however. So far we haven't faced a consumer SSD that wouldn't experience any degradation after enough torture. Given that consumer SSDs typically have only 7-15% of over-provisioned NAND, sooner than later you will run into a situation where read-modify-write is triggered, which will result in a substantial decline in write performance. With SandForce your write speed won't change (at least not by much) but the read speed goes downhill instead. It's a trade-off but neither is worse than the other as all workloads consist of both reads and writes.
To test TRIM, I TRIM'ed the drive after our 20 minute torture:
.PNG)
And here is the real issue. Normally TRIM would restore performance to clean-level state, but this is not the case. Read speed is definitely up from dirty state but it's not fully restored. Running TRIM again didn't yield any improvement either, so something is clearly broken here. Also, it didn't matter if I filled and tortured with drive with compressible, pseudo-random data, or incompressible data; the end result was always the same when I ran HD Tach.
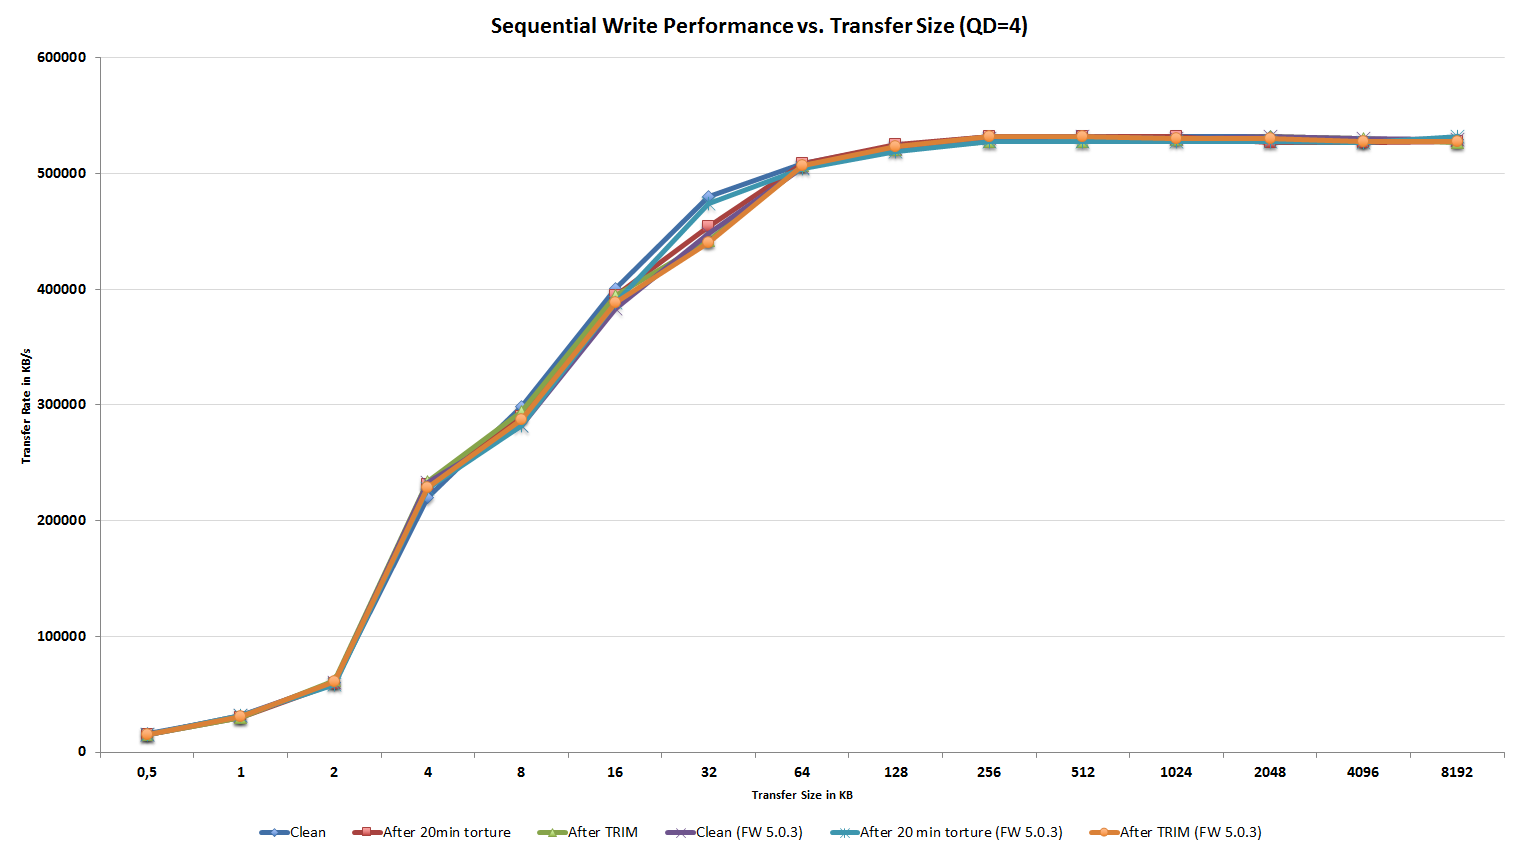
I didn't want to rely completely on HD Tach as it's always possible that one benchmark behaves differently from others, especially when it comes to SandForce. I turned to ATTO since it uses highly compressible data as well to see if it would report data similar to our HD Tach results. Once again, I first secure erased the drive, filled it with sequential data and proceeded to torture the drive with 4KB random writes (LBA space 100%, QD=32) for 20 minutes:
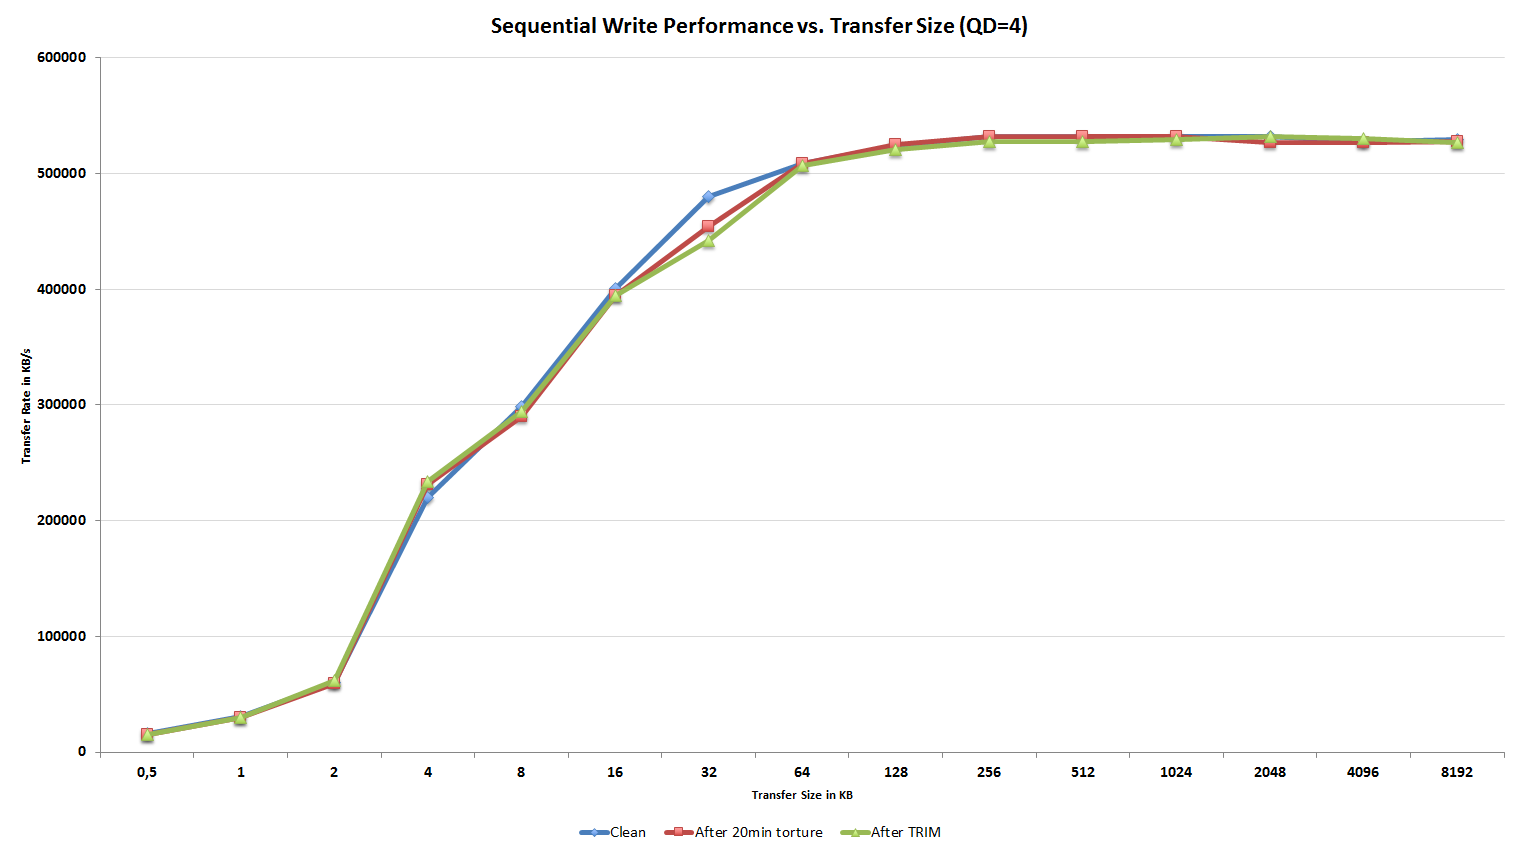
As expected, write speed is not affected except for an odd bump at transfer size of 32KB. Since we are only talking about one IO size and performance actually degraded after TRIM, it's completely possible that this is simply an error.

The read speed ATTO graph is telling the same story as our HD Tach graphs; read speed does indeed degrade and is not fully restored after TRIM. The decrease in read speed is a lot smaller compared to our HD Tach results, but it should be kept in mind that ATTO reads/writes a lot less data to the drive compared to HD Tach, which reads/writes across the whole drive.
What we can conclude from the results is that TRIM is definitely broken in SandForce SSDs with firmware 5.0.0, 5.0.1, or 5.0.2. If your SandForce SSD is running the older 3.x.x firmware, you have nothing to worry about because this TRIM issue is limited strictly to 5.x.x firmwares. Luckily, this is not the end of the world because SandForce has been aware of this issue for a long time and a fix is already available for some drives. Let's have a look how the fix works.
Firmware 5.0.3 to the Rescue
As SandForce was well aware of the issue with TRIM, it allowed them to work on a new firmware with working TRIM before the issue gained much visibility. The new firmware carries a version number 5.0.3, although manufacturers may rename the update to correspond with their one firmware naming schemes. Availability of the update depends totally on the manufacturer as all have their own validation processes, but so far I've seen at least Corsair, Kingston and SanDisk offering the updated firmware for their drives. Again, I would like to point out that not all SF-2281 based SSDs are affected; there are plenty still using the older 3.x.x firmware with working TRIM.
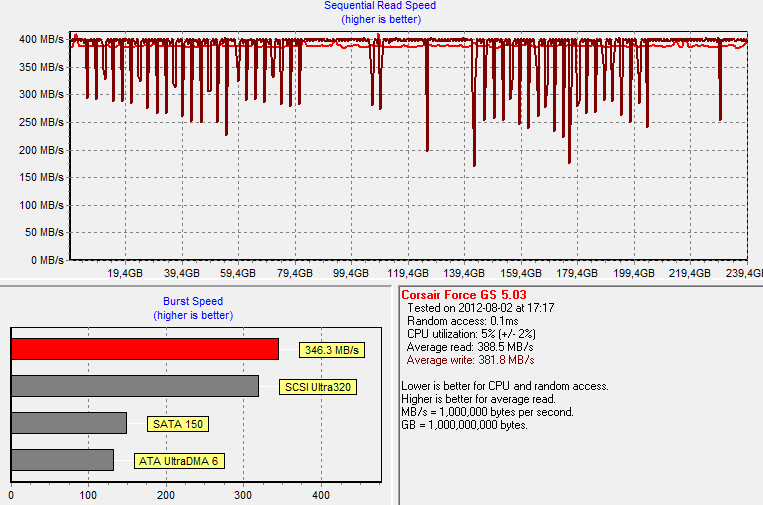
To test if TRIM finally works, I'm using the same methods as in the previous page. Here's what performance looks like after 20 minutes of torturing:
.PNG)
There are no essential differences from the 5.0.2 firmware. Read speed still degrades but like I said, this is most likely how the controller and firmware were designed, meaning that there isn't really a way to fix it.
Next I TRIM'ed the drive:
Read speed is mostly restored, though not fully, but TRIM is definitely working better than it was in 5.0.2 and earlier. It's actually normal that performance after TRIM is a few percent shy of clean performance, so the behavior we are seeing here is fairly common. However, we now have a new quirk: Write speed degradation. As you can see in the first graph, write speed after torture was 398MB/s. After TRIMing the drive, the average write speeds drops to ~382MB/s. Generally the write speed is around 400MB/s but there are at least two dozen peaks where performance drops to as low as ~175MB/s.
I TRIMed the drive again to see if there would be any improvement:
.PNG)
And there is ~9MB/s improvement in average write speed. Write speeds still drops below 200MB/s on several occasions but in total the amount of negative peaks is a lot smaller. With more sequential writes and idle time, write speed should restore to close to clean state performance.
I also ran ATTO to see if it would replicate our HD Tach results:
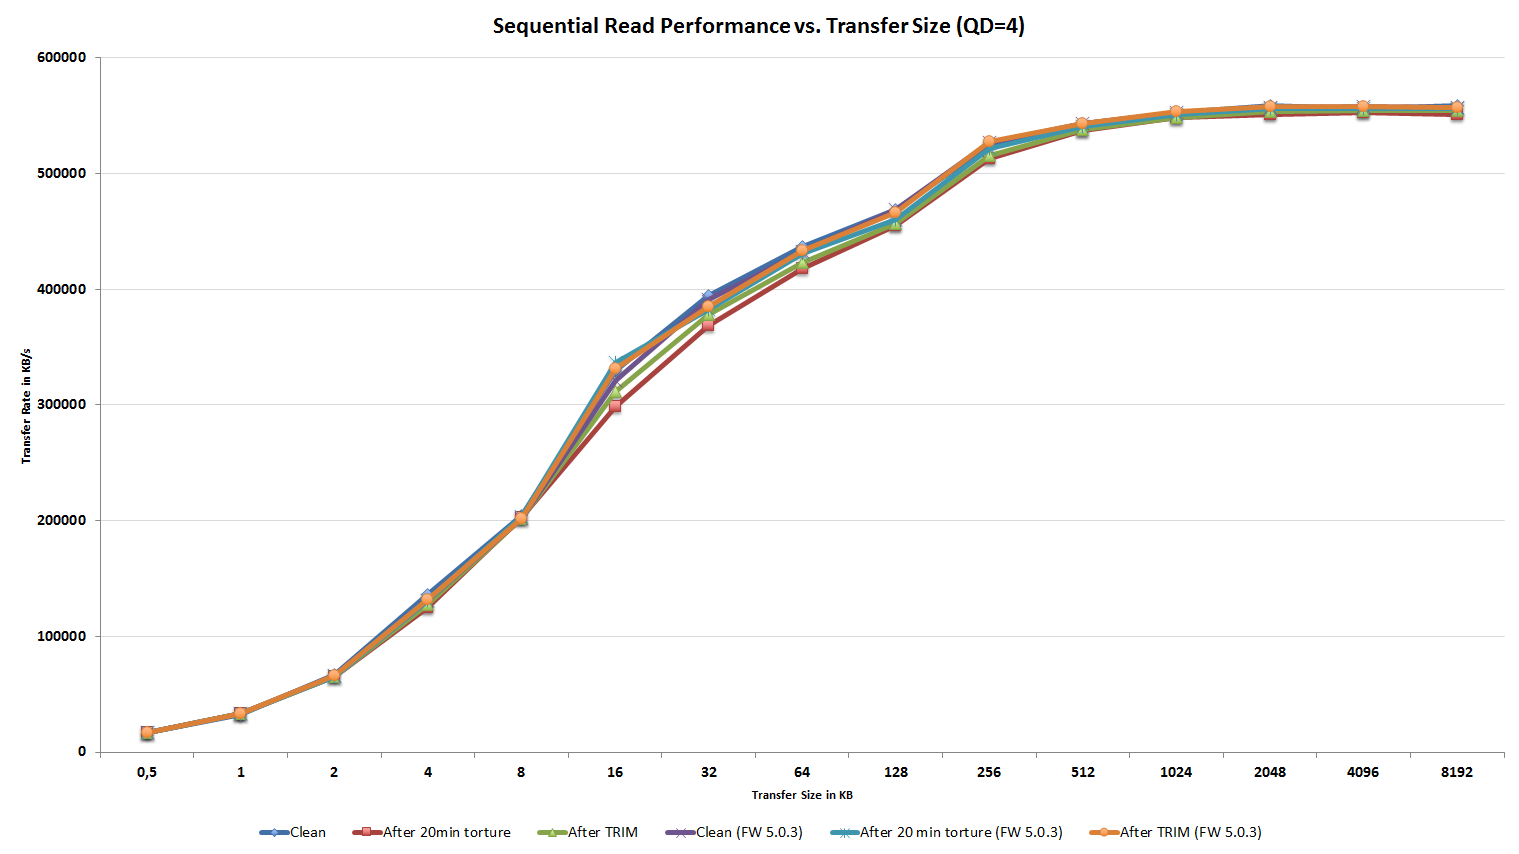
Read speed is restored after TRIM, which is what our HD Tach tests showed as well.
When tested with ATTO, write speed doesn't actually degrade aside from the transfer size of 32KB, though similar behavior happens with the 5.0.2 firmware. The above graph can be a bit hard to read because the lines are crossing each other, so I double-checked the results by looking at the raw numbers reported by ATTO and there were no major differences. Again, keep in mind that ATTO doesn't write anywhere near as much data as HD Tach does. Aside from the peaks, performance with HD Tach was similar to clean-state, so it's possible that ATTO doesn't write enough to show the peaks as well.
But How About Incompressible Data and TRIM?
I mentioned earlier that TRIM has never functioned properly in SandForce SSDs when the drive is tortured with incompressible datam, which has never been a strength of SandForce. When it faces some, it's not exactly sure what to do with it. Your data will of course be written just like compressible data, but when your whole design is based on the assumption that the data will be compressed on the fly, there are some design trade-offs when it comes to performance with incompressible data. SandForce has said that third generation controllers should bring vast improvements to incompressible performance but we have no concrete numbers as of yet.
To test how TRIM behaves with incompressible data, I filled the Force GS with incompressible data and then tortured it with incompressible 4KB random writes (100% LBA space, QD=32) for 60 minutes:
| Corsair Force GS—Resiliency—AS SSD—6Gbps | ||||
| Read Speed | Write Speed | |||
| Firmware | 5.0.2 | 5.0.3 | 5.0.2 | 5.0.3 |
| Clean | 494.1MB/s | 507.6MB/s | 270.5MB/s | 266.8MB/s |
| After Torture | 372.3MB/s | 501.1MB/s | 74.9MB/s | 156.2MB/s |
| After TRIM | 479.8MB/s | 506.0MB/s | 220.2MB/s | 150.3MB/s |
With firmware 5.0.2, both read and write speed degrade when tortured. The read speed doesn't degrade as much as write speed, but there is still a clear drop in performance. Fortunately TRIM will mostly restore read performance so there doesn't seem to be a similar problem as with compressible data. Write performance, on the other hand, restores but not fully. After TRIM write performance is about 81% of clean state performance, which isn't bad but not ideal either.
Firmware 5.0.3 seems to bring some changes to how incompressible data is dealt with. TRIM still doesn't work properly but as I've said before, I believe it's the way how the controller and firmware were designed, meaning that there isn't really a way to fix it. The good news is that write speed doesn't degrade nearly as much after torture as it did with firmware 5.0.2. Read speed also stays on-par with clean state performance. On the other hand, TRIM doesn't restore performance at all. As a matter of fact TRIM actually degrades write speed slightly but the difference is small enough to not raise any real concern. We did experience similar behavior with HD Tach, though.
Conclusion
SSD performance is all about trade-offs. As you improve one area, you generally weaken another. For example, you can opt for a large logical block size and get super fast sequential write speeds. The flip side is that random write speed will be horrible. Another good example is SandForce. They have chosen to concentrate on performance with compressible data, which has resulted in a trade-off with incompressible data performance.
Since it's generally impossible to have everything in one package, creating a good firmware and SSD is all about finding the balance. SandForce's approach in firmware 5.0.3 is in the right direction but it's far from perfect. TRIM now restores read speed after torture but in exchange, write speed takes a hit. I'm more satisfied with this behavior because the degradation in write speed is smaller and it seems that sequential writes and idle time will help to restore performance back to clean state. With firmware 5.0.2, read speed degraded for good; TRIMing the drive again and running HD Tach for several times didn't show any improvement.
What I'm more worried about is the TRIM behavior with incompressible data. With 5.0.2, TRIM at least worked somewhat as performance was better after TRIM than after torture. Sure, write speed doesn't go as low as it did with 5.0.2 but since most SSDs are used in TRIM-supported environments, I would rather take worse worst-case performance and partially working TRIM.
Hopefully SandForce will be able to find the right balance in a future firmware, which would be working TRIM regardless of the nature of data. 5.0.3 is a good start, but I feel that it concentrates too much on fixing one problem and as a result creates a bunch of new ones.
The Corsair Force GS
Now that the TRIM issue is out of the way, it's time to take a closer look at Corsair's Force GS SSD. Not much has happened in the SandForce SSD frontier for a while and the Force GS isn't exactly special either. As with most SandForce based SSDs, it's based on SandForce's SF-2281 controller, although Corsair has chosen SanDisk, a bit more uncommon choice, as the NAND supplier. SanDisk's NAND uses the same Toggle-Mode interface as Toshiba's and Samsung's NAND, which is rarer in SandForce SSDs than ONFi NAND. That's not to say that the Force GS is the first Toggle-Mode NAND based SandFroce SSD; there are quite a few that use Toggle-Mode NAND as well, such as OWC's Mercury 6G and Mushkin's Chronos Deluxe.
| Comparison of NAND Interfaces | ||||||
| ONFi | Toggle-Mode | |||||
| Manufacturers | IMFT (Intel, Micron, Spectec), Hynix | Toshiba/SanDisk, Samsung | ||||
| Version | 1.0 | 2.0 | 2.x | 3.0 | 1.0 | 2.0 |
| Max Bandwidth | 50MB/s | 133MB/s | 200MB/s | 400MB/s | 166MB/s | 400MB/s |
By using Toggle-Mode NAND, Corsair claims to achieve slightly higher write speeds than ONFi based SandForce SSDs, although the difference is only about 5MB/s in sequential write and 5K IOPS in 4K random write. While SanDisk NAND is quite rare, it should not be of lower quality than any other NAND. Toshiba and SanDisk have a NAND joint venture similar to Intel's and Micron's IMFT: SanDisk owns 49.9% and Toshiba owns the remaining 50.1% of the joint venture. As the NAND comes from the same fabs, there is no physical difference between SanDisk and Toshiba NAND, although validation methods may of course be different.
| Corsair Force Series GS Specifications | ||||
| User Capacity | 180GB | 240GB | 360GB | 480GB |
| Controller | SandForce SF-2281 | |||
| NAND | SanDisk 24nm Toggle-Mode MLC NAND | |||
| Raw NAND Capacity | 192GiB | 256GiB | 384GiB | 512GiB |
| Number of NAND Packages | 12 | 16 | 12 | 16 |
| Number of Die per Package | 2 | 2 | 4 | 4 |
| Sequential Read | 555MB/s | 555MB/s | 555MB/s | 555MB/s |
| Sequential Write | 525MB/s | 525MB/s | 530MB/s | 455MB/s |
| Max 4K Random Write | 90K IOPS | 90K IOPS | 50K IOPS | 50K IOPS |
The interesting thing in Force GS are the available capacities; Corsair isn't offering anything smaller than 180GB and there is also a more uncommon 360GB model included. As explained in our pipeline article of the Force GS launch, 180GB and 360GB models are achieved by running the SF-2281 controller in 6-channel mode and using either 6 or 12 NAND packages. Corsair only had 240GB review samples available, but they promised to send us a 360GB sample once they get them.
| Price Comparison (11/22/2012) | |||||
| 120/128GB | 180GB | 240/256GB | 360GB | 480/512GB | |
| Corsair Force GS | N/A | $160 | $220 | $315 | $400 |
| Corsair Force GT | $130 | $185 | $220 | N/A | $390 |
| Corsair Neutron | $120 | N/A | $213 | N/A | N/A |
| Plextor M5S | $110 | N/A | $200 | N/A | N/A |
| Crucial m4 | $110 | N/A | $185 | N/A | $389 |
| Intel 520 Series | $130 | $190 | $234 | N/A | $370 |
| Samsung SSD 830 | $104 | N/A | $200 | N/A | $550 |
| OCZ Vertex 3 | $89 | N/A | $200 | N/A | $425 |
| OCZ Vertex 4 | $75 | N/A | $160 | N/A | $475 |
| Mushkin Chronos Deluxe | $100 | N/A | $180 | N/A | N/A |
Force GS is priced competitively against other SSDs at all capacities. All capacities are priced noticeably below $1 per GB, even the not so common 180GB and 360GB models. Of course, it should be kept in mind that SSD prices change frequently (e.g. some of the models like the 480GB Vertex 3 have dropped in price by 30% or more in the past two months!), so you should do your own research before buying. We can only quote the prices at the time of writing, there is a good chance that our pricing table will be at least somewhat out of date in less than a week.
Inside The Corsair Force GS
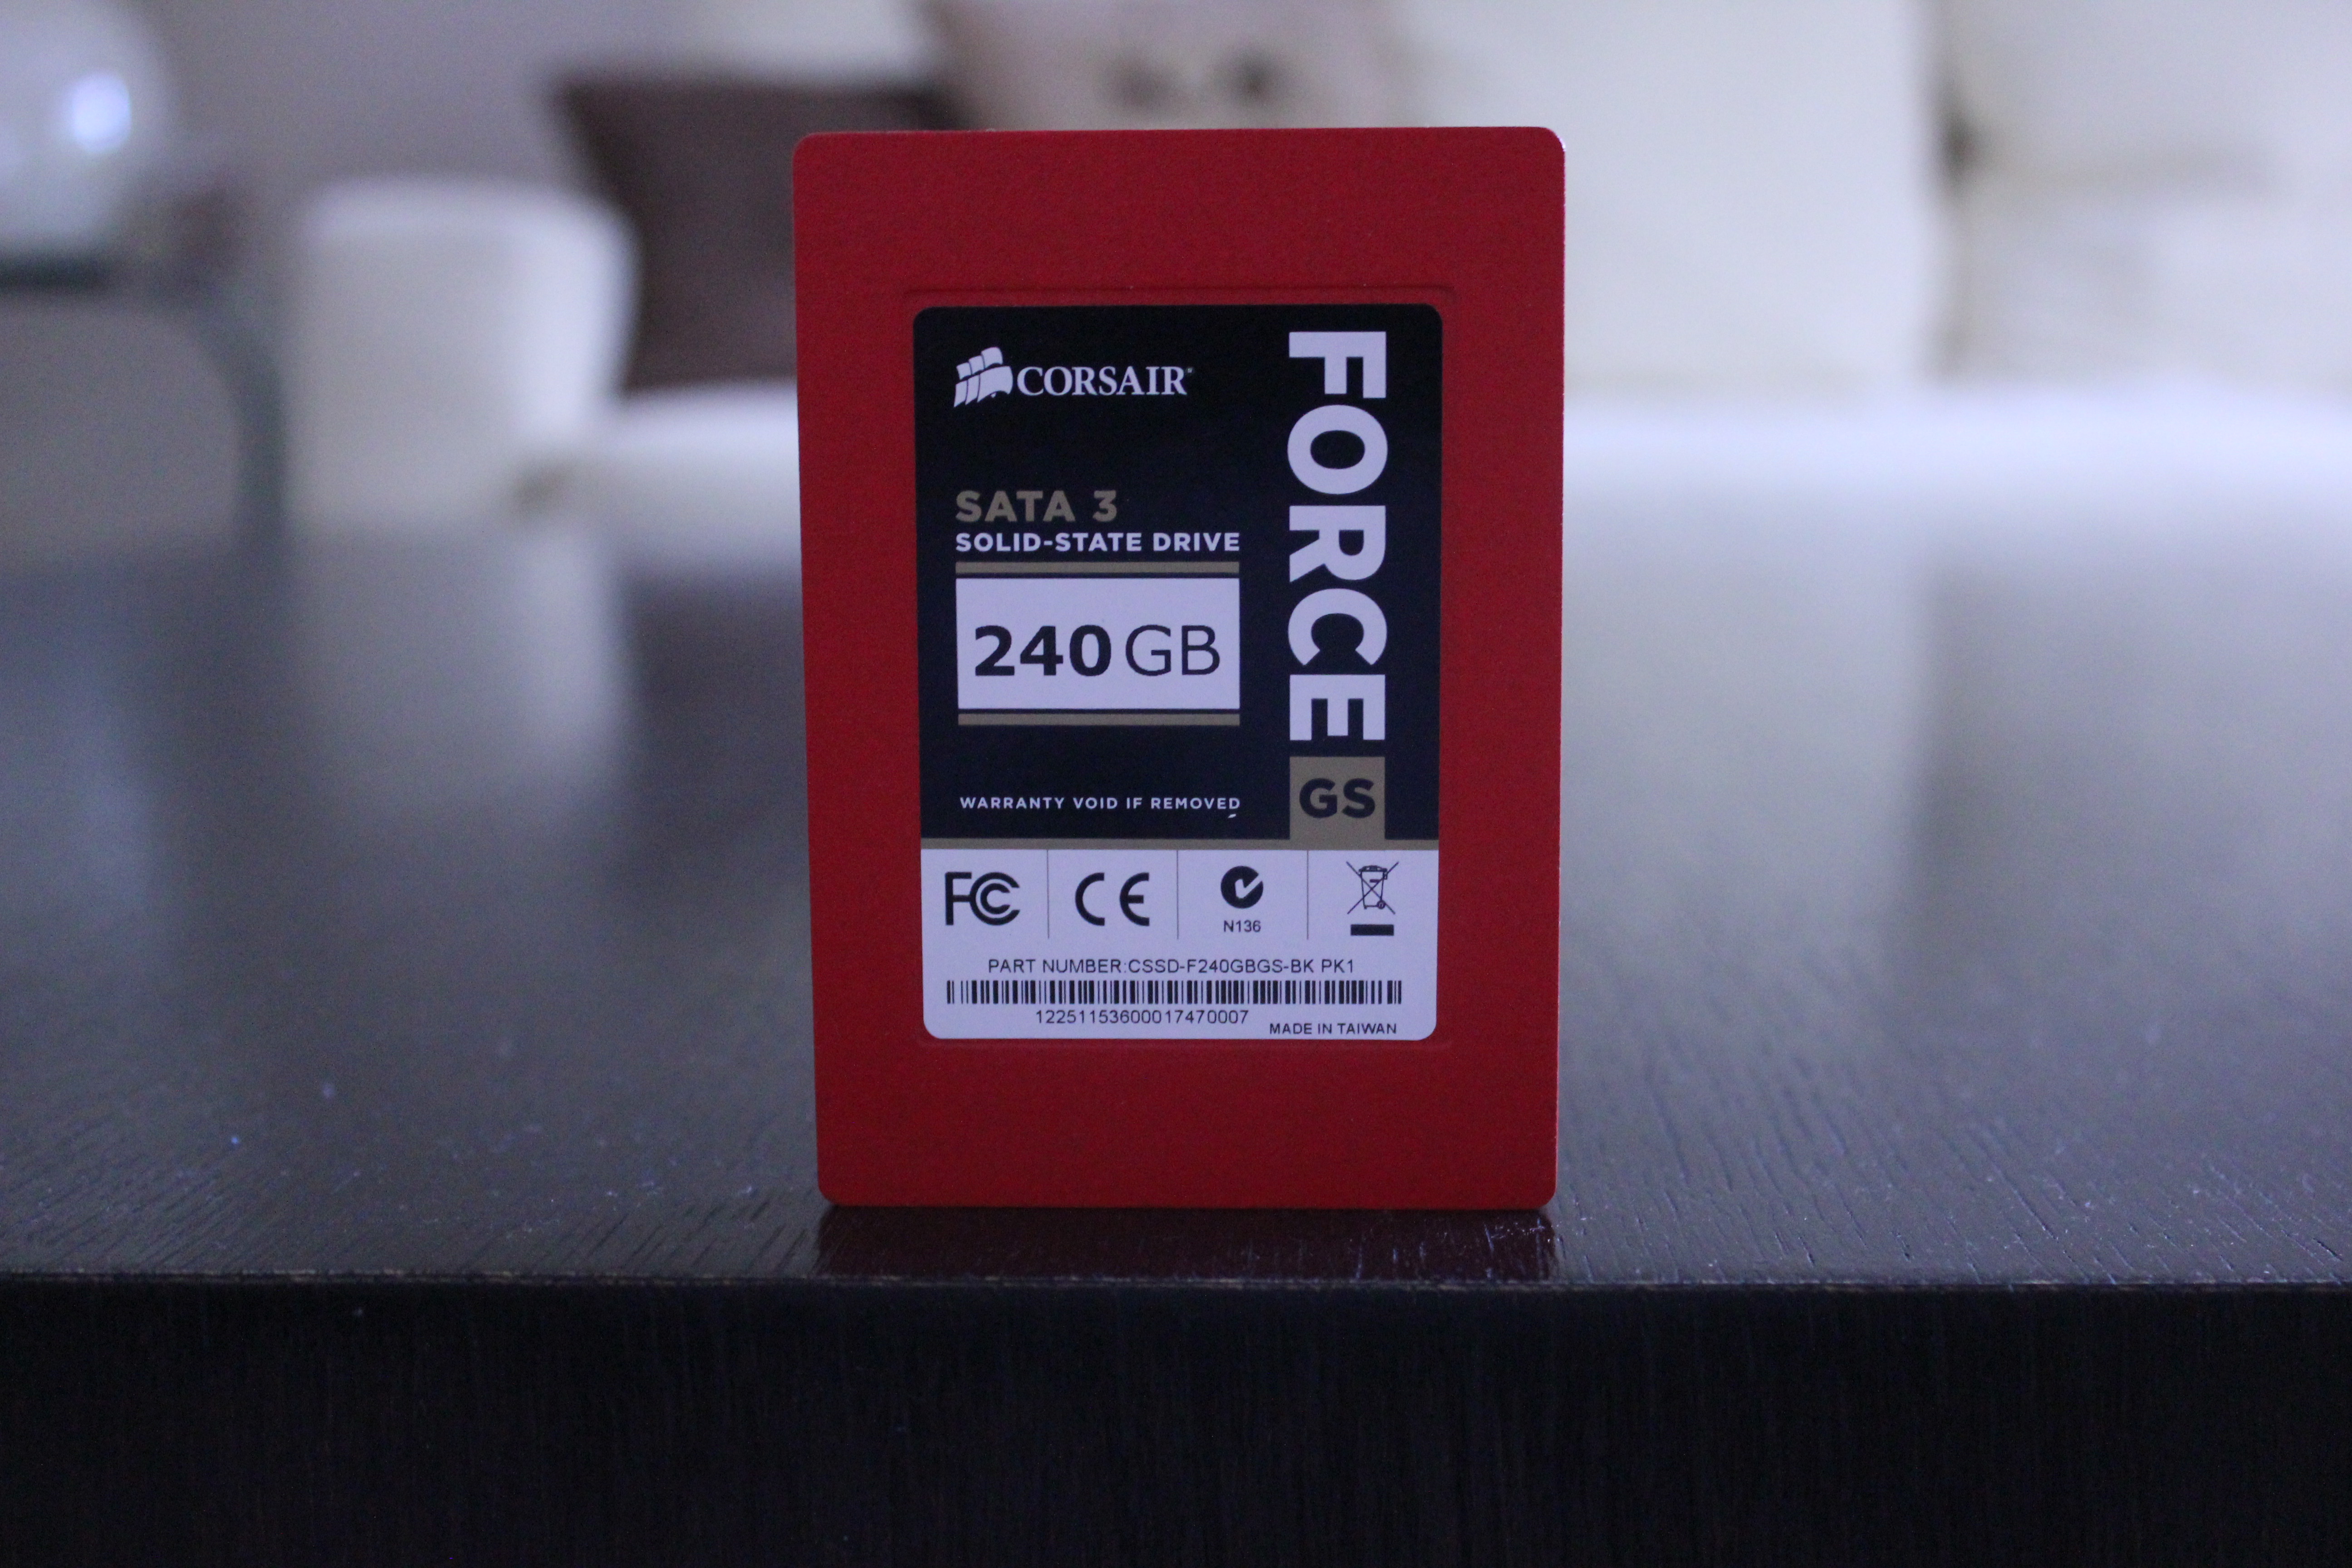
Corsair's Force GS uses a similar red plastic chassis as the Force GT.
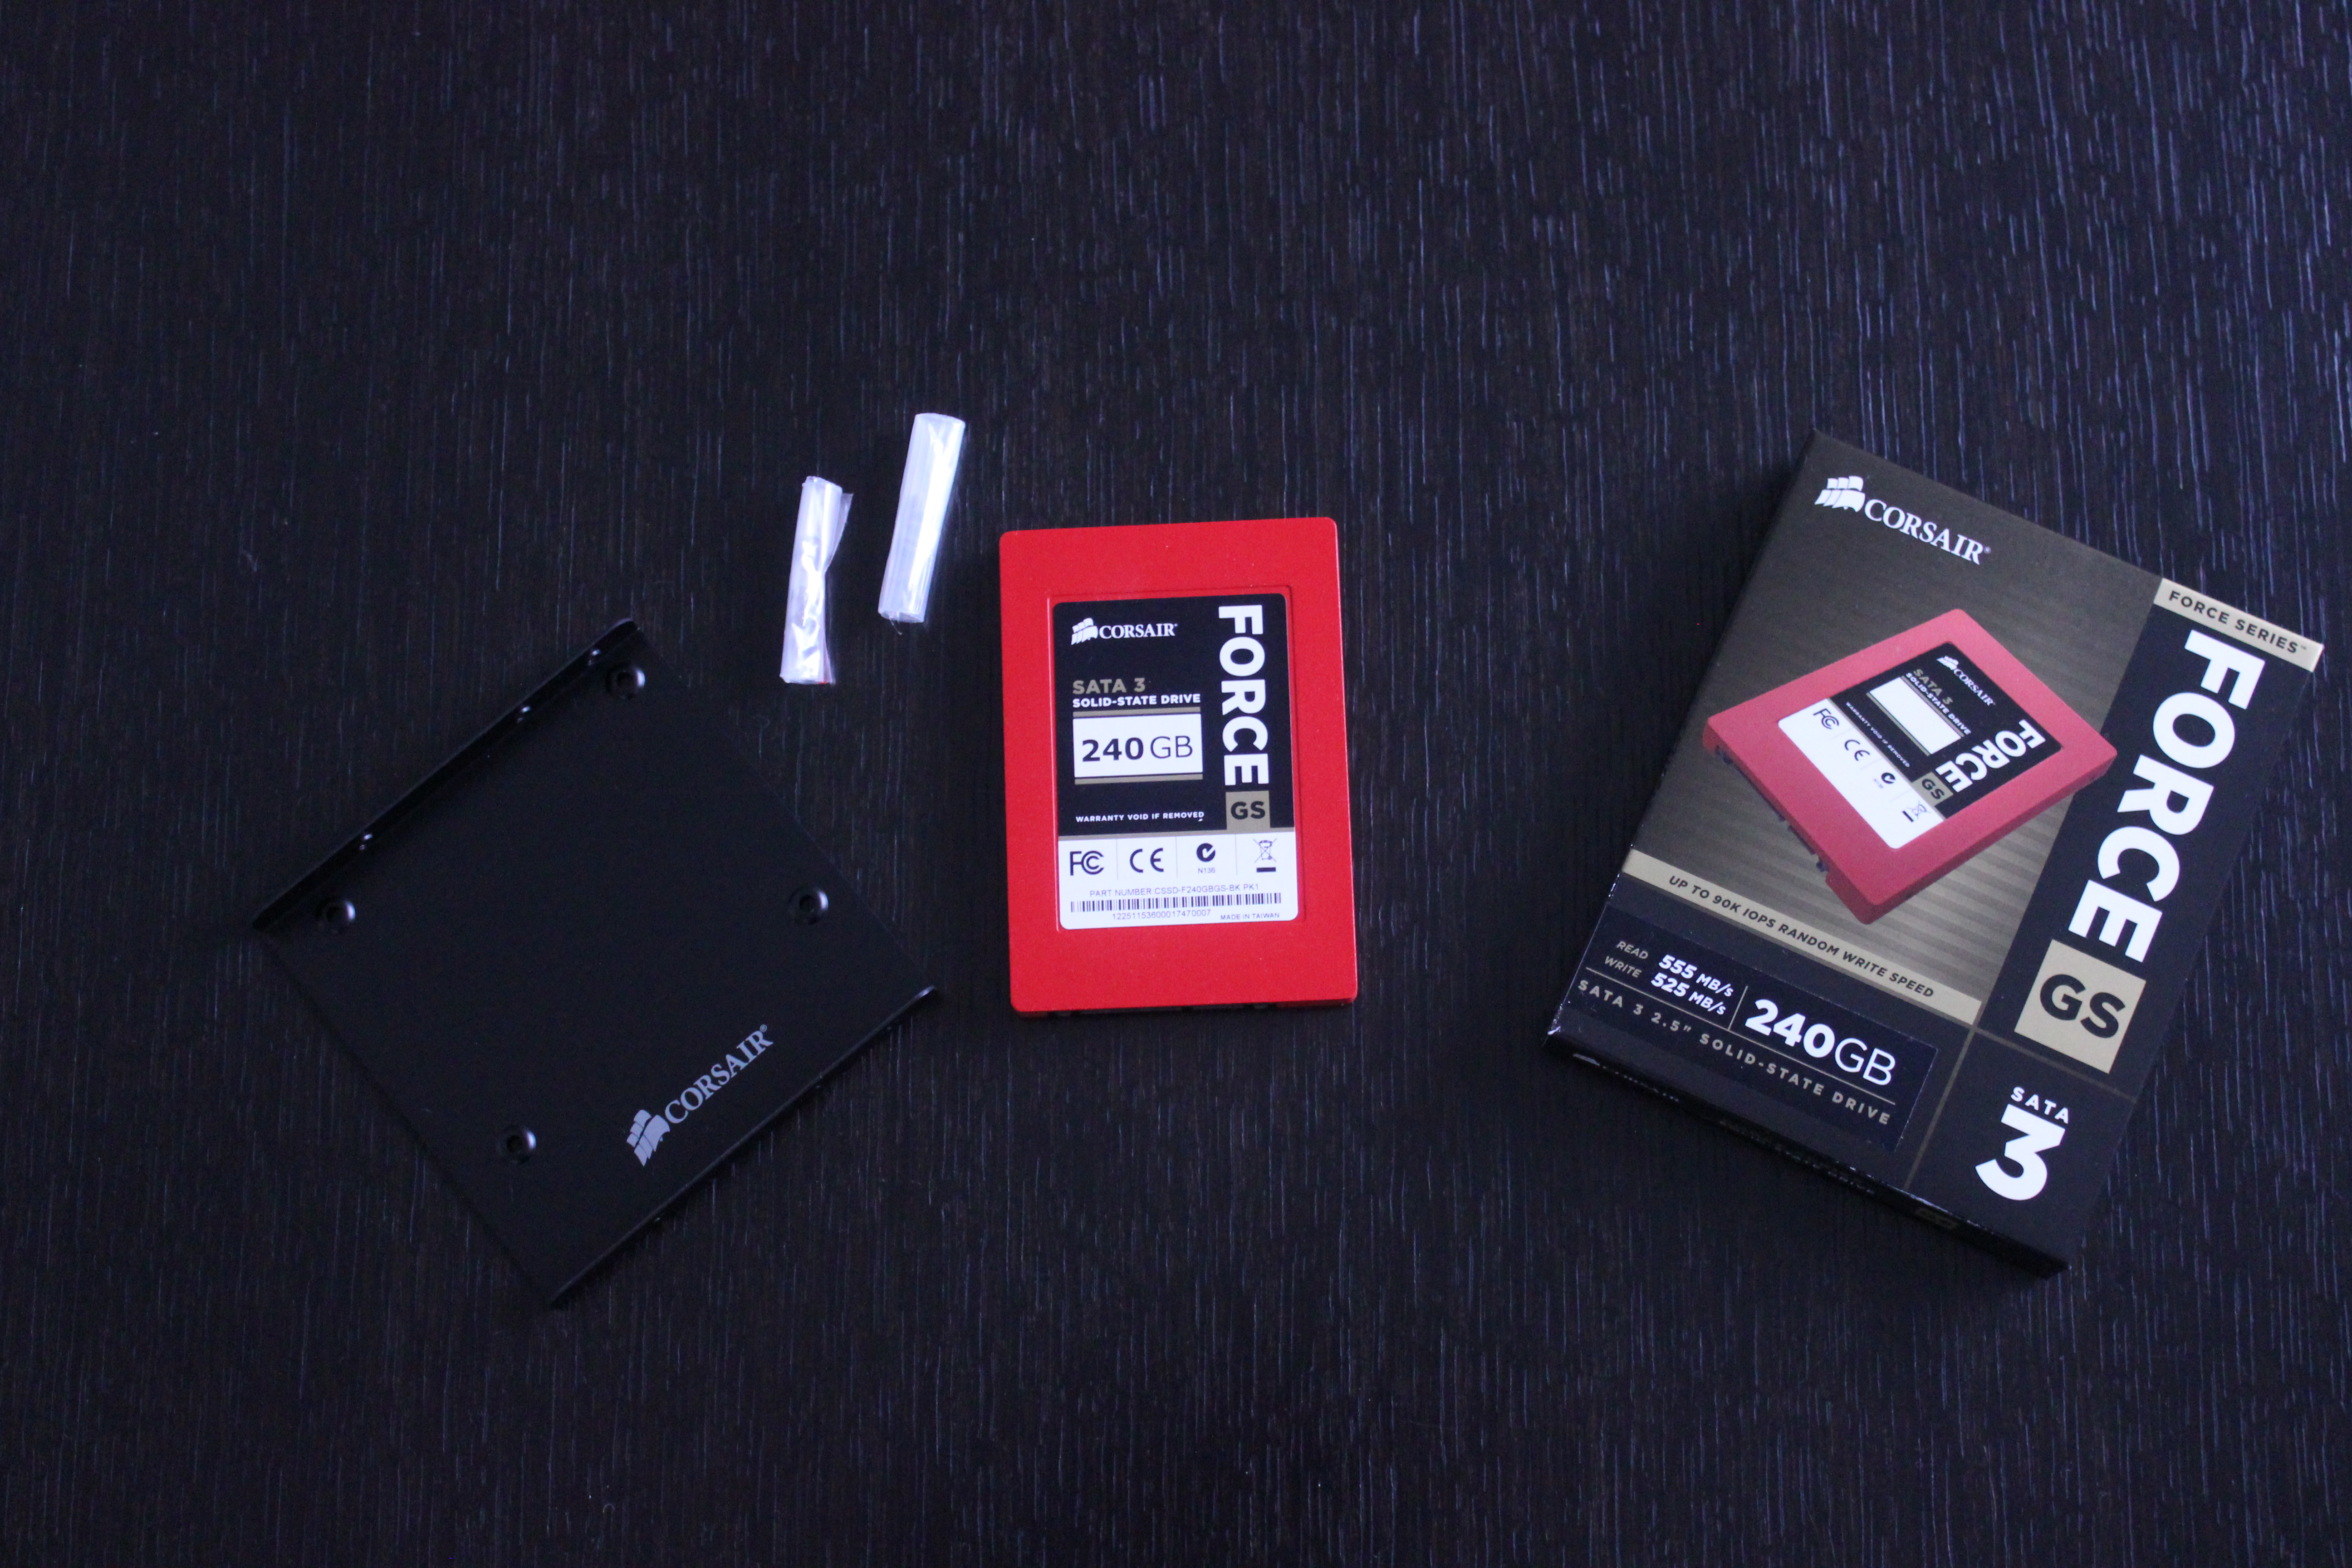
Included in the retail bundle are two sets of mounting screws and a 2.5" to 3.5" adapter.
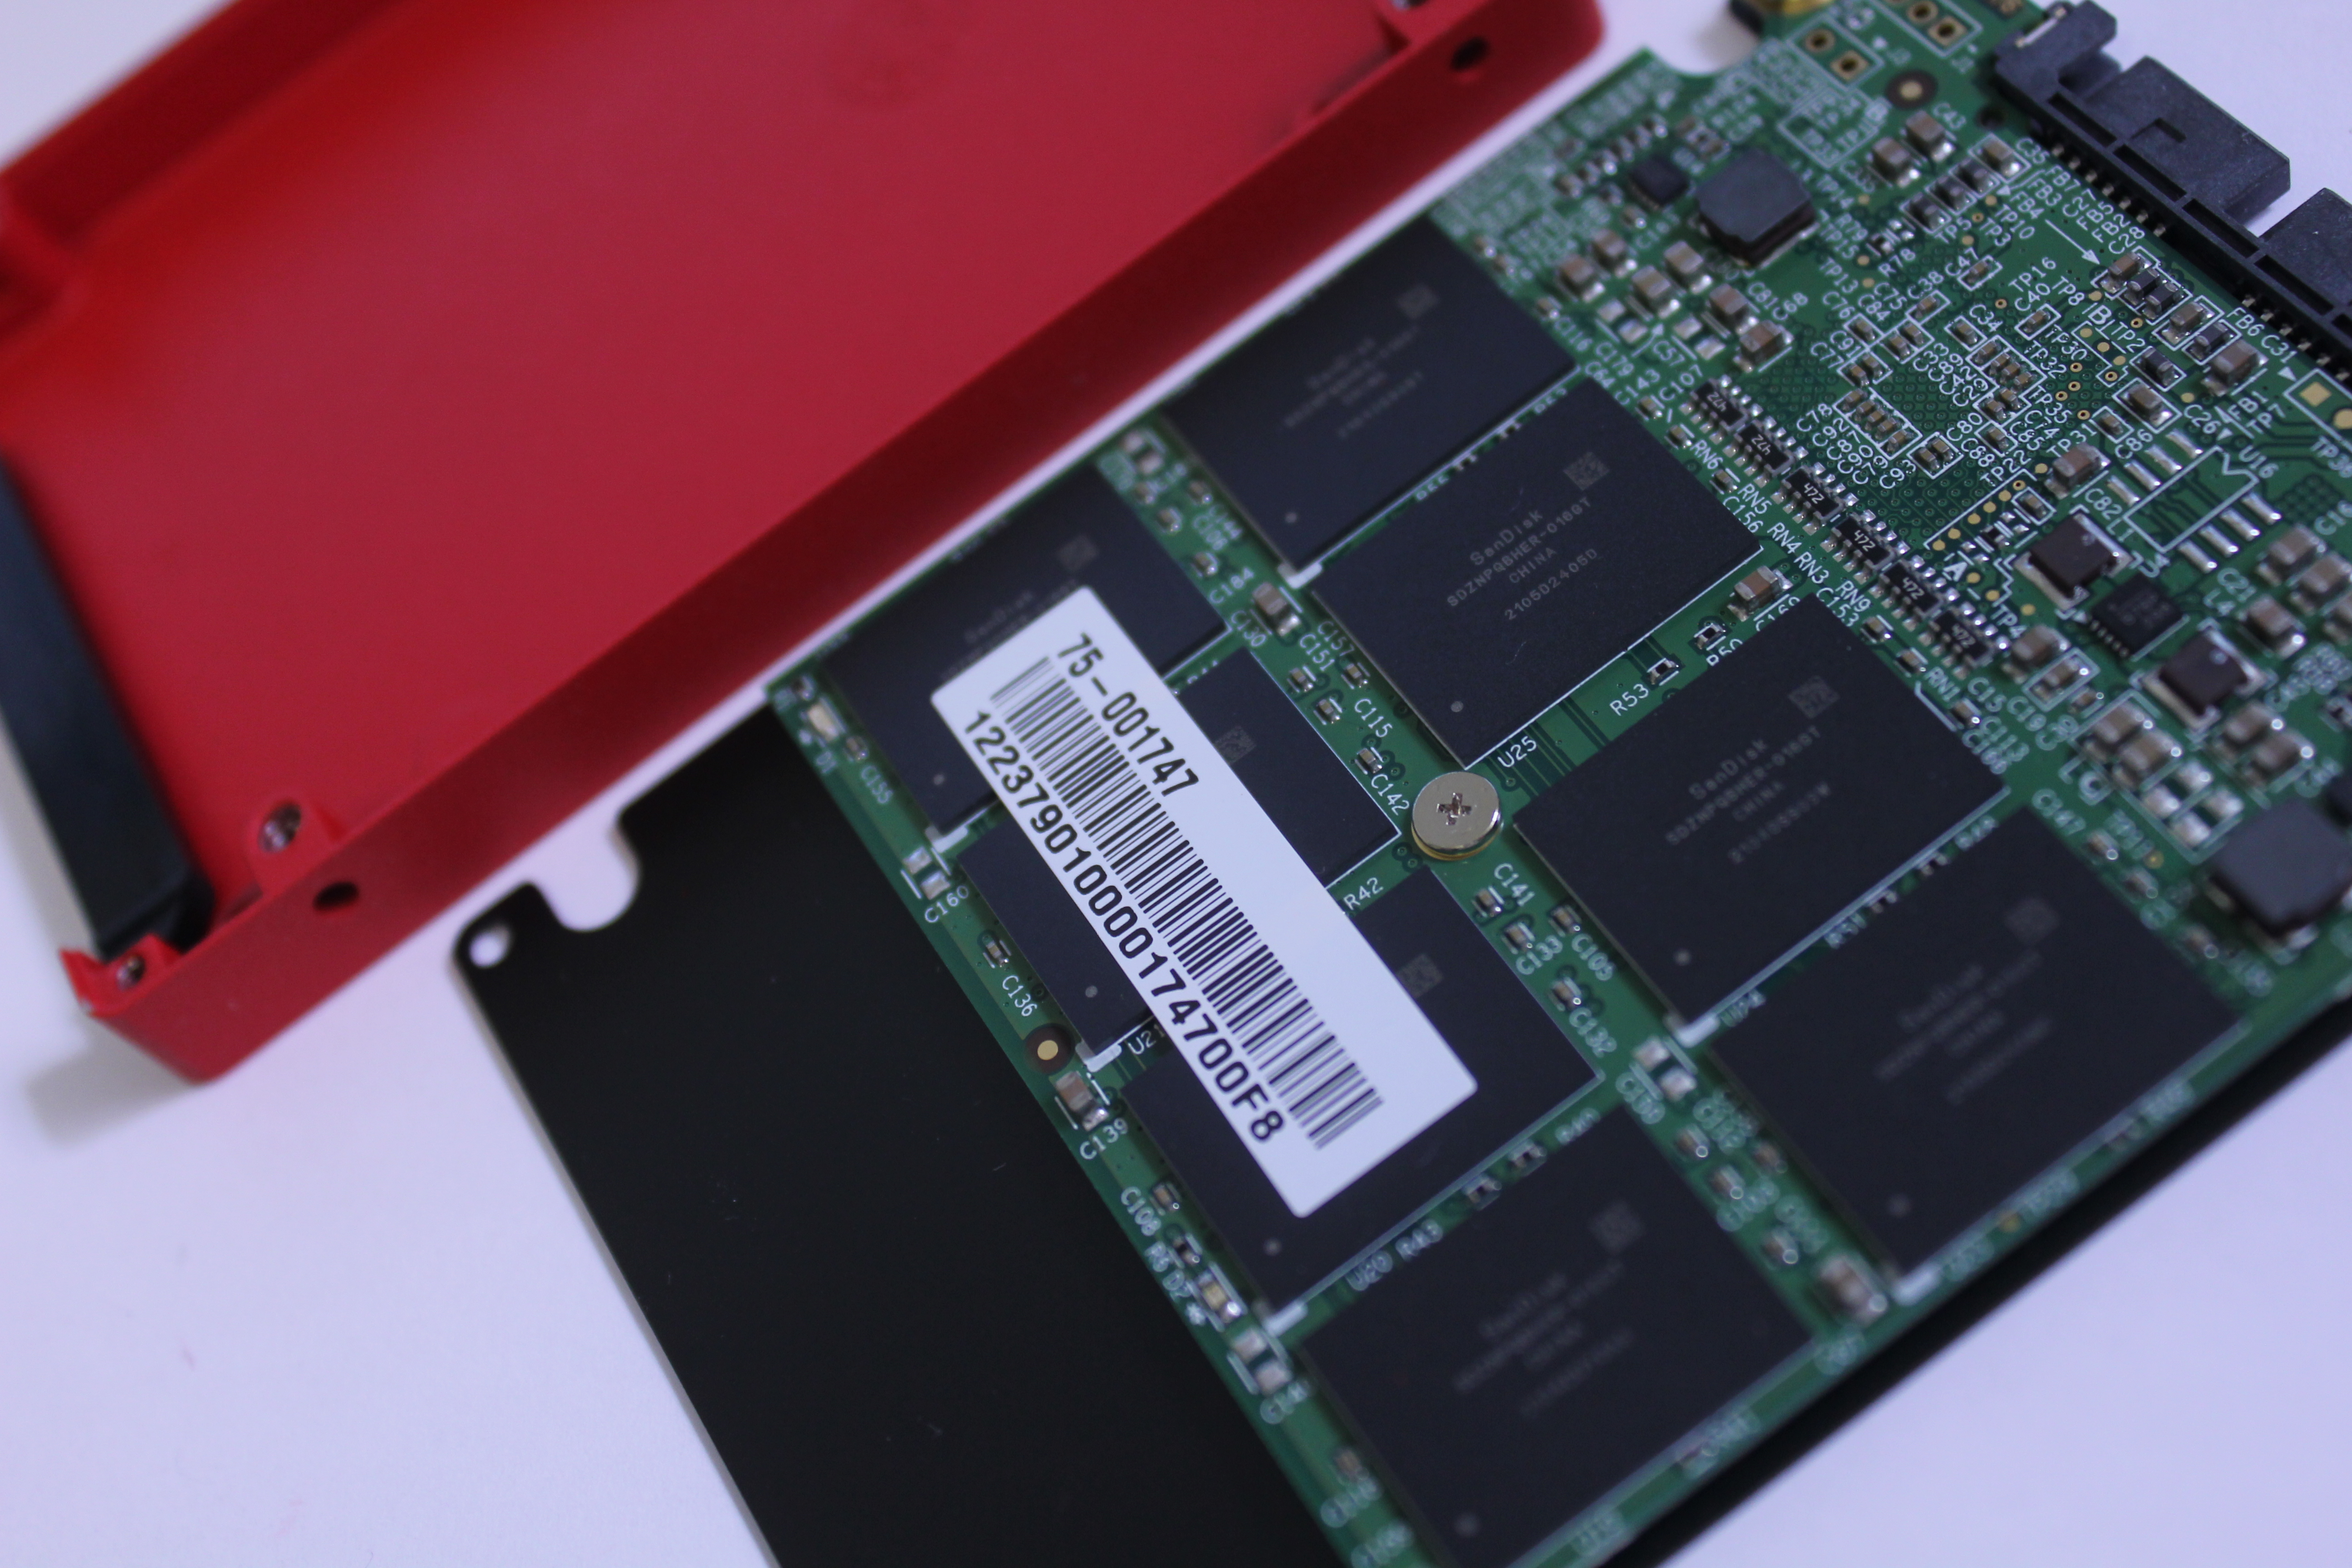
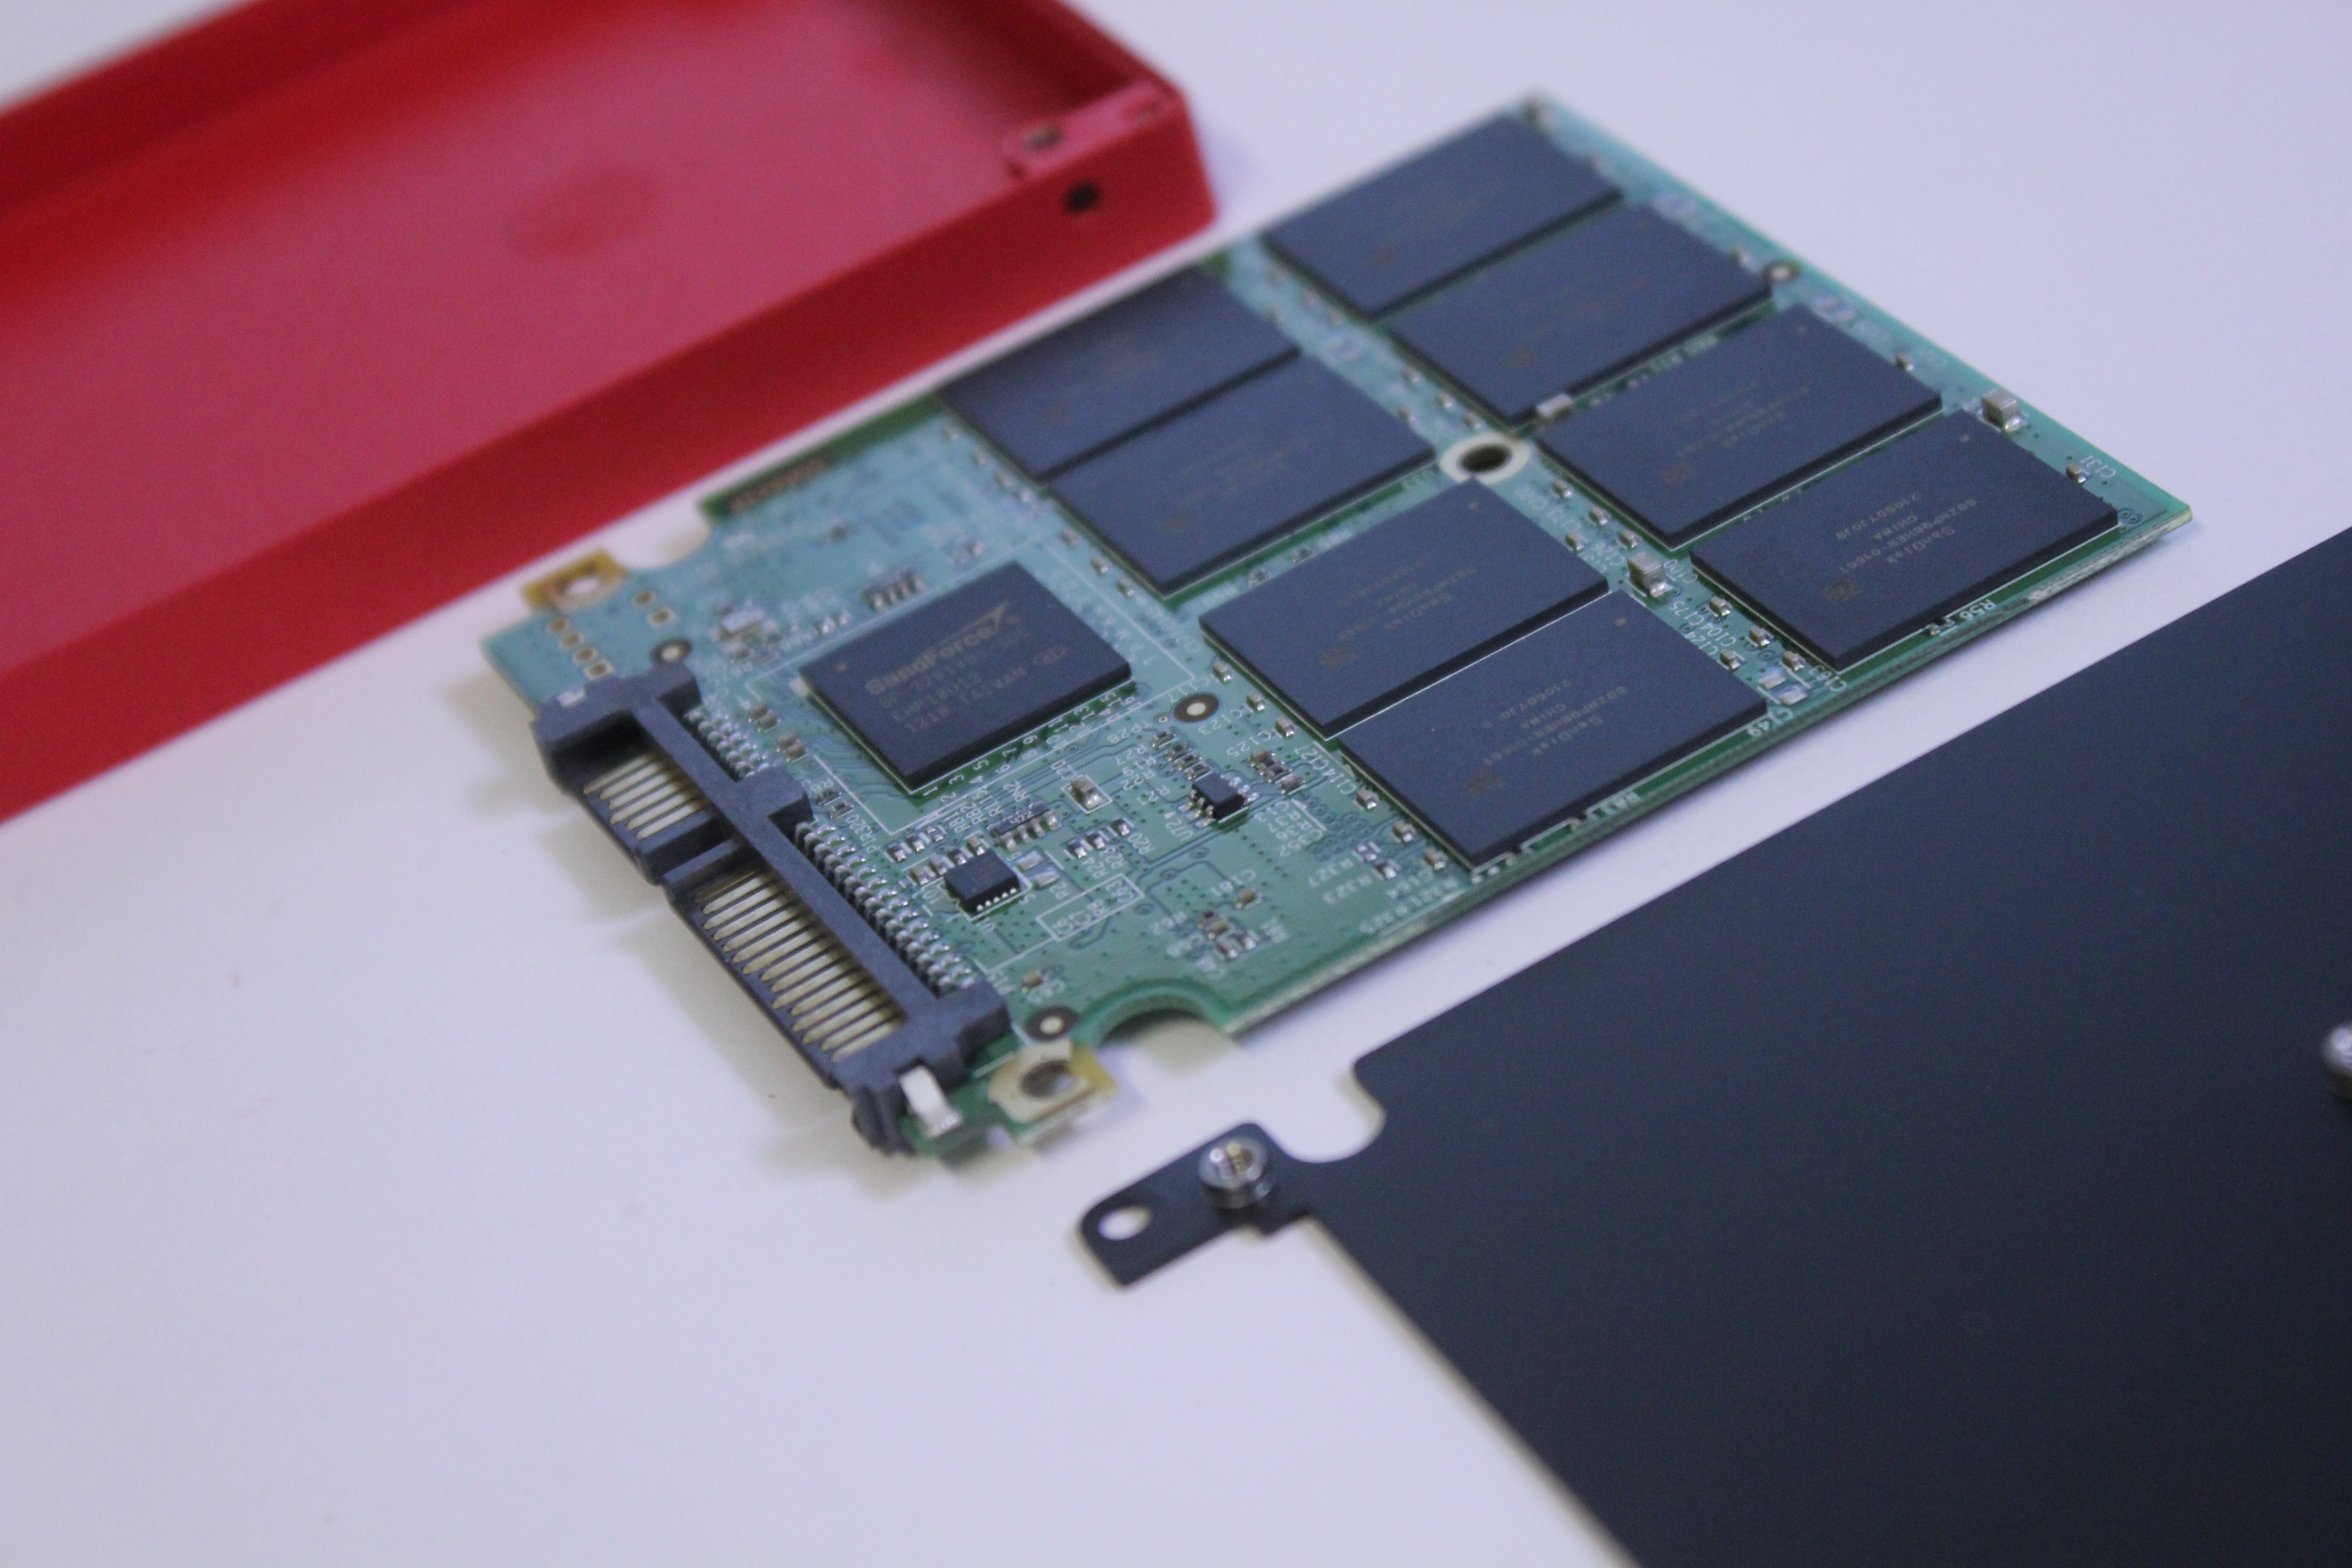
The actual PCB is a bit different from what we normally find inside 2.5" SSDs. Its length is only about four fifths of the backplane and it's held in tact by three screws (two in the corners, one in the middle) instead of four. I'm guessing the smaller PCB is slightly cheaper than a regular size 2.5" PCB would have been, hence Corsair opted for one. I don't really see any other explanation because the chassis is still normal size and weight benefit is marginal.
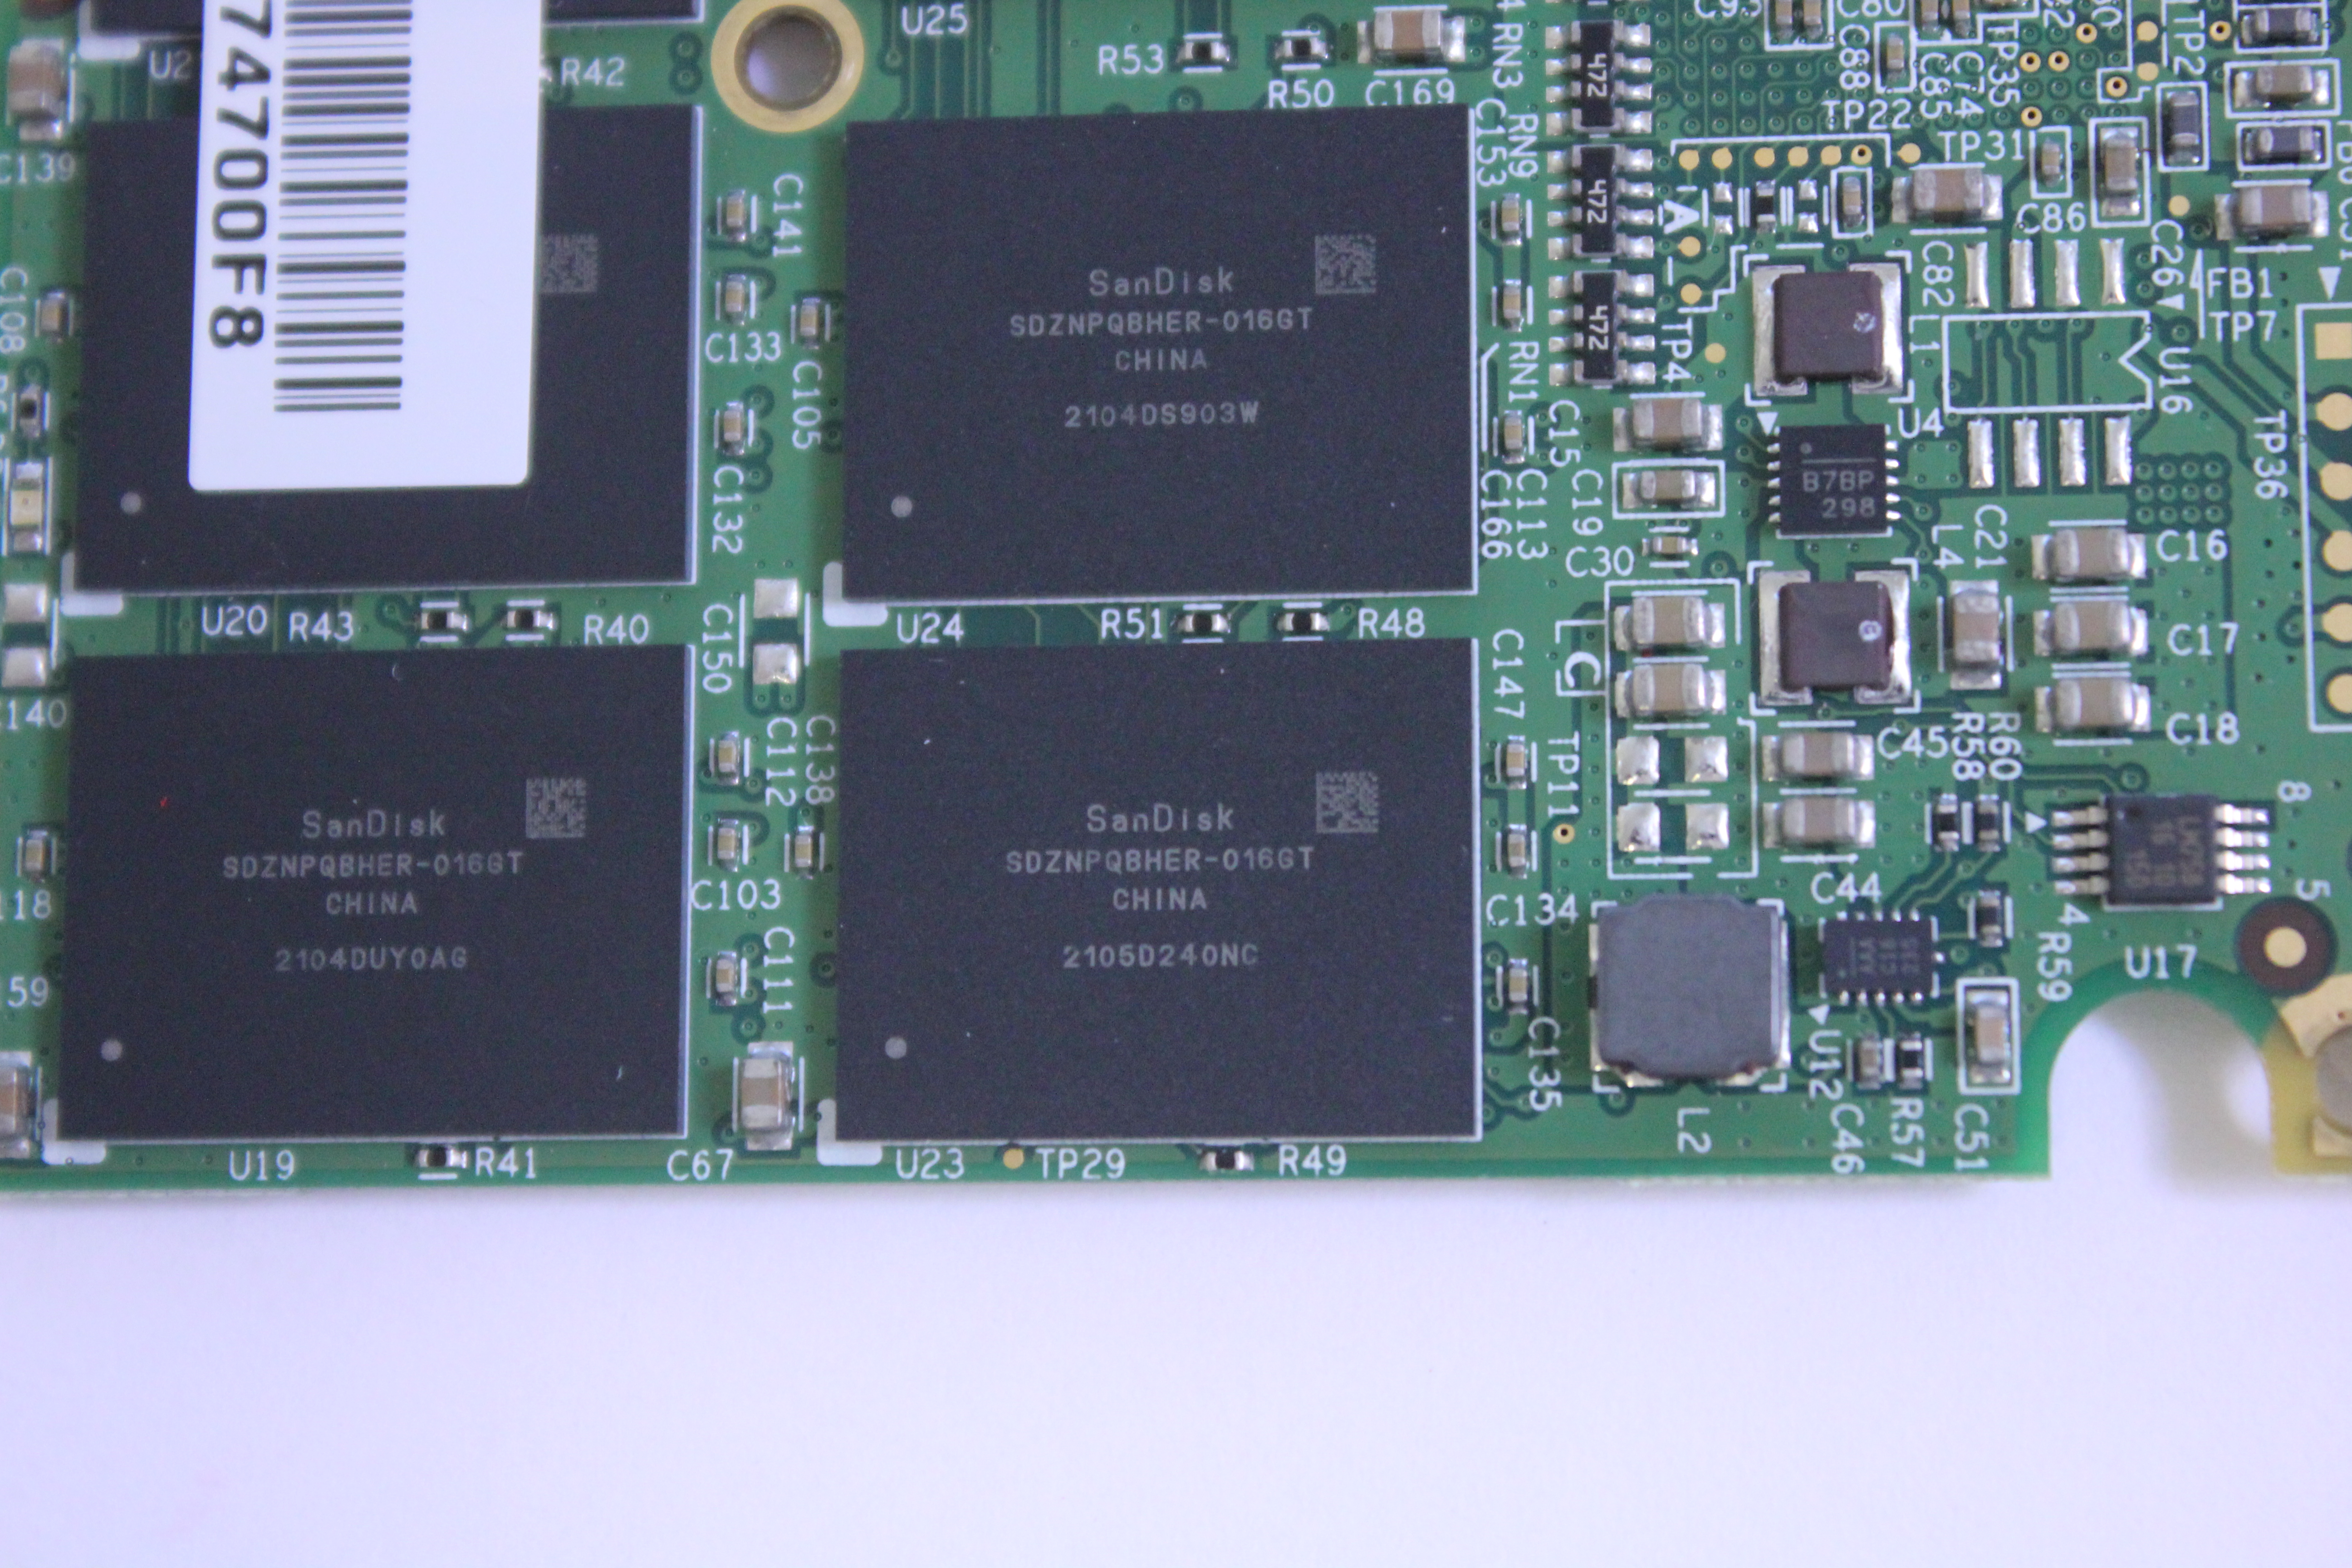
As for the components, there are eight SanDisk's 24nm Toggle-Mode MLC NAND packages on this side of the PCB. These are 16GB packages, meaning that each package consists of two 8GB dies.
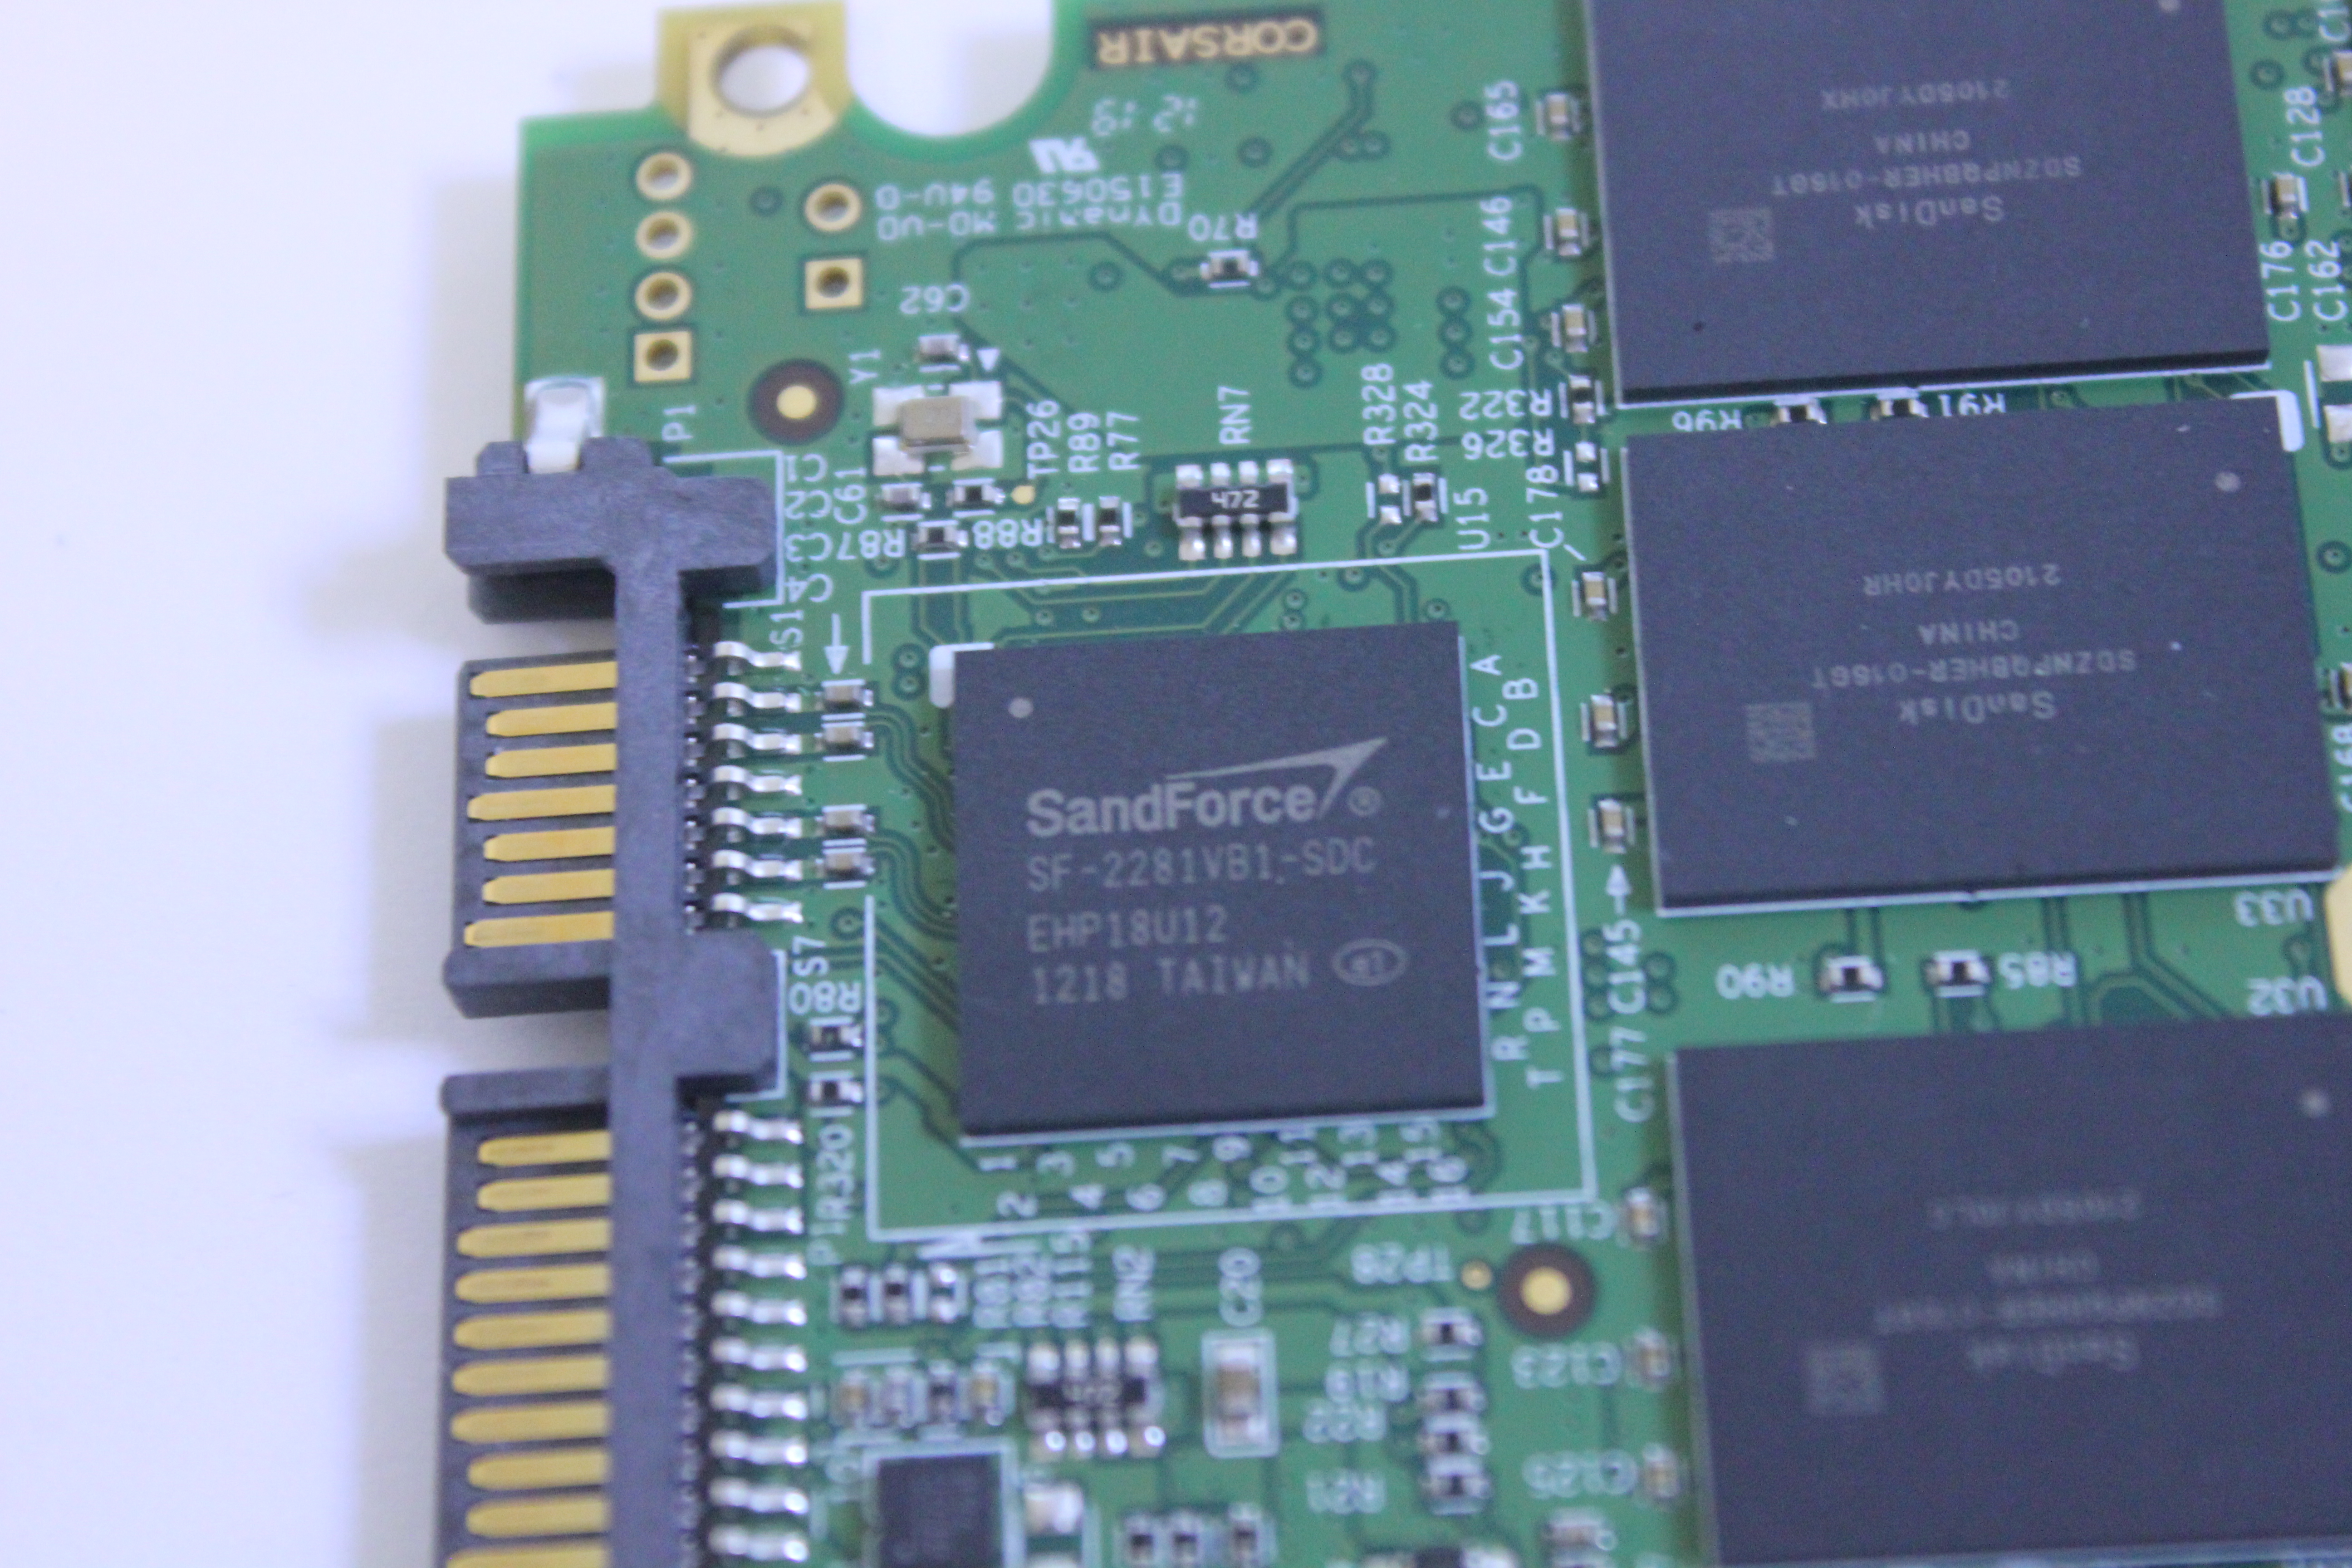
Remove the backplane and flip the PCB around and we find another eight NAND packages and SandForce's SF-2281 controller.
Corsair isn't using thermal pads, which isn't all that suprising. Typically thermal pads are only found in high-end SSDs while lower-end models come without in order to offer more competitive pricing.
Test System
| CPU |
Intel Core i5-2500K running at 3.3GHz (Turbo and EIST enabled) |
| Motherboard |
AsRock Z68 Pro3 |
| Chipset |
Intel Z68 |
| Chipset Drivers |
Intel 9.1.1.1015 + Intel RST 10.2 |
| Memory | G.Skill RipjawsX DDR3-1600 2 x 4GB (9-9-9-24) |
| Video Card |
XFX AMD Radeon HD 6850 XXX (800MHz core clock; 4.2GHz GDDR5 effective) |
| Video Drivers | AMD Catalyst 10.1 |
| Desktop Resolution | 1920 x 1080 |
| OS | Windows 7 x64 |
Random Read/Write Speed
The four corners of SSD performance are as follows: random read, random write, sequential read and sequential write speed. Random accesses are generally small in size, while sequential accesses tend to be larger and thus we have the four Iometer tests we use in all of our reviews. Our first test writes 4KB in a completely random pattern over an 8GB space of the drive to simulate the sort of random access that you'd see on an OS drive (even this is more stressful than a normal desktop user would see).
We perform three concurrent IOs and run the test for 3 minutes. The results reported are in average MB/s over the entire time. We use both standard pseudo randomly generated data for each write as well as fully random data to show you both the maximum and minimum performance offered by SandForce based drives in these tests. The average performance of SF drives will likely be somewhere in between the two values for each drive you see in the graphs. For an understanding of why this matters, read our original SandForce article.
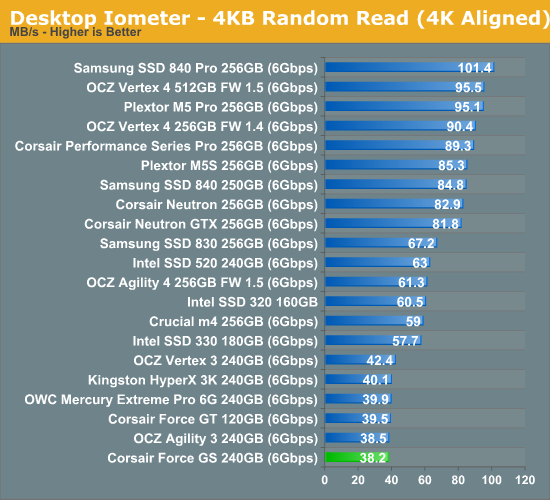
Random read speed has never been SandForce's strength and the Force GS is no exception. Real-time compression doesn't provide much benefit to read performance because reading from NAND has always been much faster than programming. Presumably SandForce's third generation controllers (SF-3000) will address random read and write performance, although it's way too early to tell how big of improvements we should expect.
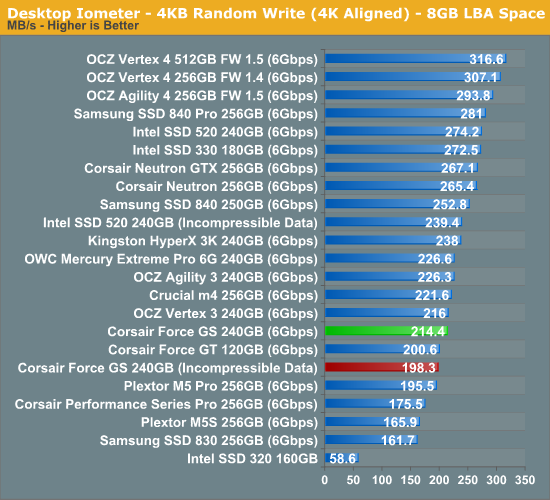
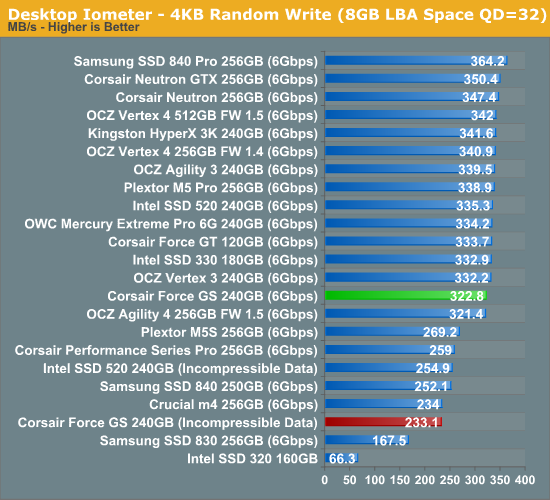
Random write performance is exceptionally low. At queue depth of 3 (the first random write graph), the Force GS manages to stay roughly on-par with other SF-2281 based SSDs, but at queue depth of 32 there is a more noticeable difference. While we are only talking about a difference of a few percents, it's still surprising that the Force GT doesn't achieve speeds similar to other SF-2281 SSDs.
Sequential Read/Write Speed
To measure sequential performance we ran a one minute long 128KB sequential test over the entire span of the drive at a queue depth of 1. The results reported are in average MB/s over the entire test length.
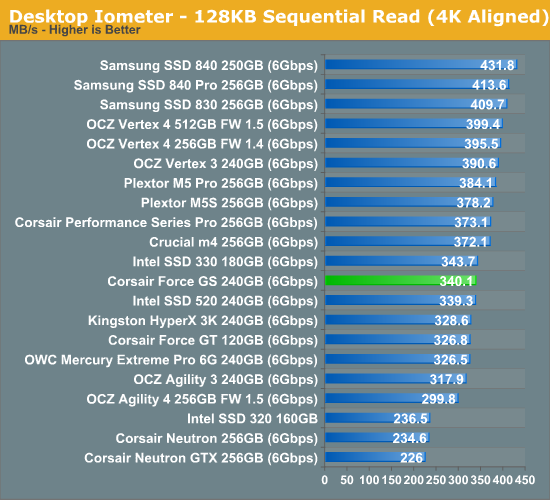
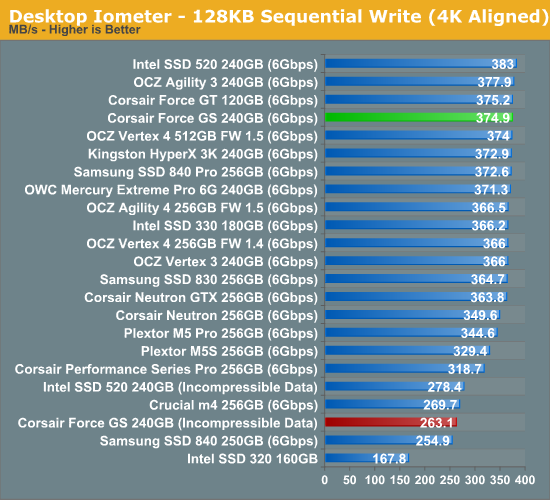
Sequential performance is typical SandForce. With highly compressible data, SandForce SSDs are still the fastest in sequential write speed, although OCZ Vertex 4 is getting very close.
AS-SSD Incompressible Sequential Performance
The AS-SSD sequential benchmark uses incompressible data for all of its transfers. The result is a pretty big reduction in sequential write speed on SandForce based controllers, while other drives continue to work at roughly the same speed as with compressible data.
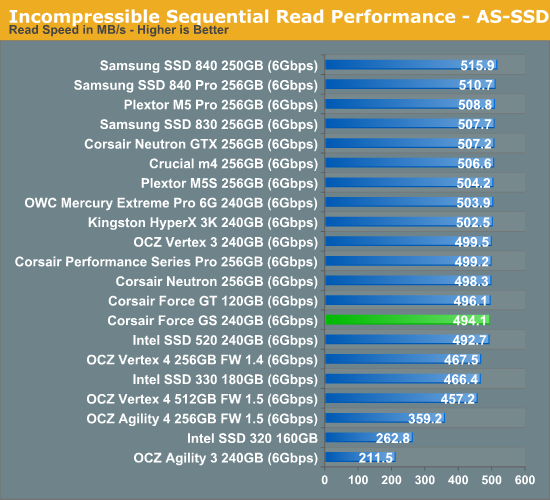
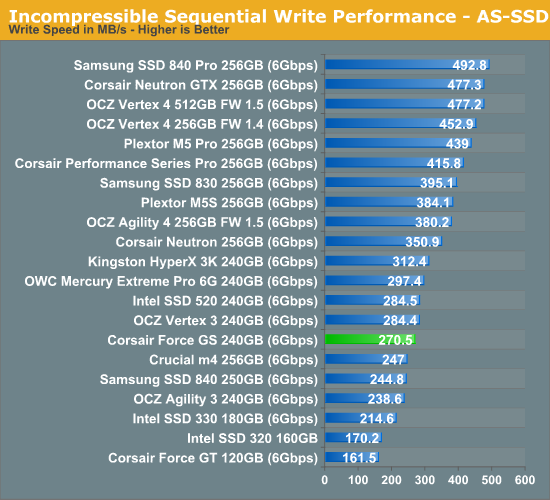
No surprises in incompressible sequential performance. Incompressible write performance is another aspect that SandForce is focusing on with their SF-3000 series; it's too early for concrete numbers but any and all improvements are welcome.
AnandTech Storage Bench 2011
Last year we introduced our AnandTech Storage Bench, a suite of benchmarks that took traces of real OS/application usage and played them back in a repeatable manner. Anand assembled the traces out of frustration with the majority of what we have today in terms of SSD benchmarks.
Although the AnandTech Storage Bench tests did a good job of characterizing SSD performance, they weren't stressful enough. All of the tests performed less than 10GB of reads/writes and typically involved only 4GB of writes specifically. That's not even enough exceed the spare area on most SSDs. Most canned SSD benchmarks don't even come close to writing a single gigabyte of data, but that doesn't mean that simply writing 4GB is acceptable.
Originally we kept the benchmarks short enough that they wouldn't be a burden to run (~30 minutes) but long enough that they were representative of what a power user might do with their system. Later, however, we created what we refer to as the Mother of All SSD Benchmarks (MOASB). Rather than only writing 4GB of data to the drive, this benchmark writes 106.32GB. This represents the load you'd put on a drive after nearly two weeks of constant usage. And it takes a long time to run.
1) The MOASB, officially called AnandTech Storage Bench 2011—Heavy Workload, mainly focuses on the times when your I/O activity is the highest. There is a lot of downloading and application installing that happens during the course of this test. Our thinking was that it's during application installs, file copies, downloading, and multitasking with all of this that you can really notice performance differences between drives.
2) We tried to cover as many bases as possible with the software incorporated into this test. There's a lot of photo editing in Photoshop, HTML editing in Dreamweaver, web browsing, game playing/level loading (Starcraft II and WoW are both a part of the test), as well as general use stuff (application installing, virus scanning). We included a large amount of email downloading, document creation, and editing as well. To top it all off we even use Visual Studio 2008 to build Chromium during the test.
The test has 2,168,893 read operations and 1,783,447 write operations. The IO breakdown is as follows:
| AnandTech Storage Bench 2011—Heavy Workload IO Breakdown | ||||
| IO Size | % of Total | |||
| 4KB | 28% | |||
| 16KB | 10% | |||
| 32KB | 10% | |||
| 64KB | 4% | |||
Only 42% of all operations are sequential; the rest ranges from pseudo to fully random (with most falling in the pseudo-random category). Average queue depth is 4.625 IOs, with 59% of operations taking place in an IO queue of 1.
Many of you have asked for a better way to really characterize performance. Simply looking at IOPS doesn't really say much. As a result we're going to be presenting Storage Bench 2011 data in a slightly different way. We'll have performance represented as Average MB/s, with higher numbers being better. At the same time we'll be reporting how long the SSD was busy while running this test. These disk busy graphs will show you exactly how much time was shaved off by using a faster drive vs. a slower one during the course of this test. Finally, we will also break out performance into reads, writes, and combined. The reason we do this is to help balance out the fact that this test is unusually write intensive, which can often hide the benefits of a drive with good read performance.
There's also a new light workload for 2011. This is a far more reasonable, typical every day use case benchmark. It has lots of web browsing, photo editing (but with a greater focus on photo consumption), video playback, as well as some application installs and gaming. This test isn't nearly as write intensive as the MOASB but it's still multiple times more write intensive than what we were running last year.
We don't believe that these two benchmarks alone are enough to characterize the performance of a drive, but hopefully along with the rest of our tests they will help provide a better idea. The testbed for Storage Bench 2011 has changed as well. We're now using a Sandy Bridge platform with full 6Gbps support for these tests.
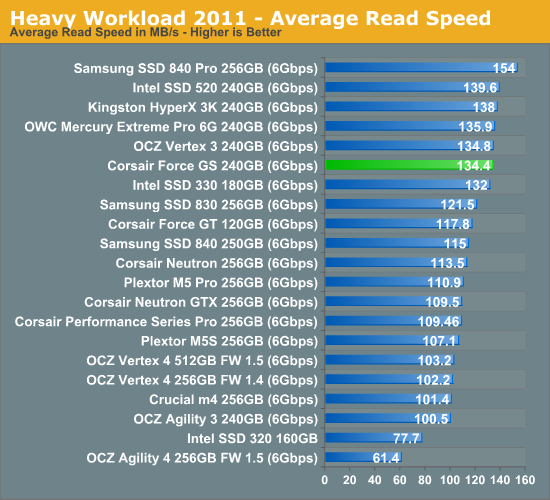
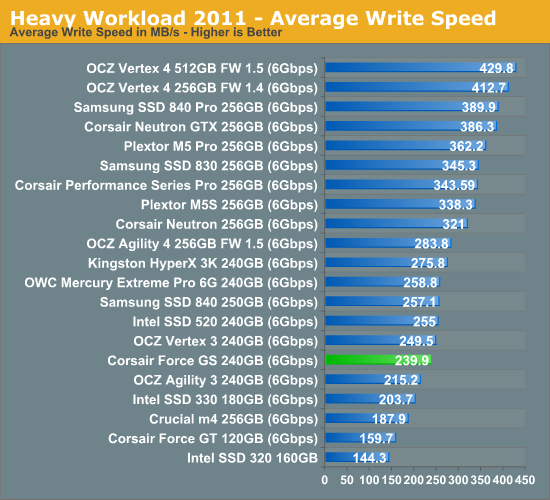
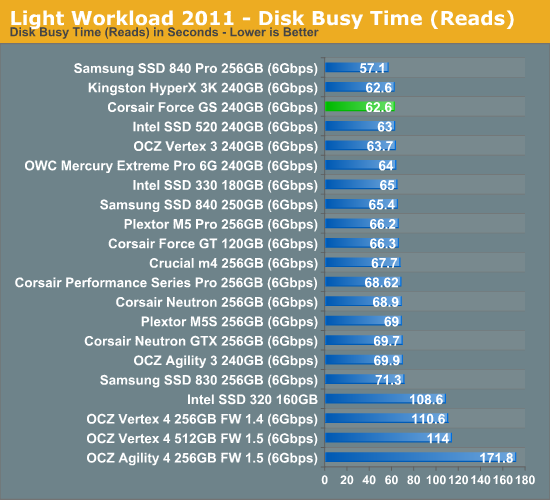
AnandTech Storage Bench 2011—Heavy Workload
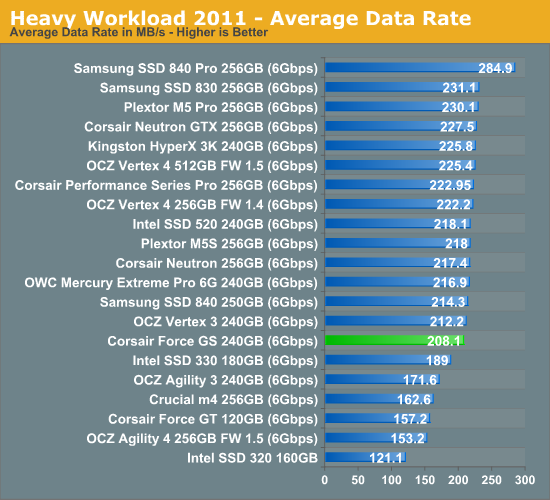
The anomalies in random write performance definitely show up in our Heavy storage suite as well. As the two graphs below show, read performance is completely normal but write speed is slower than usual.
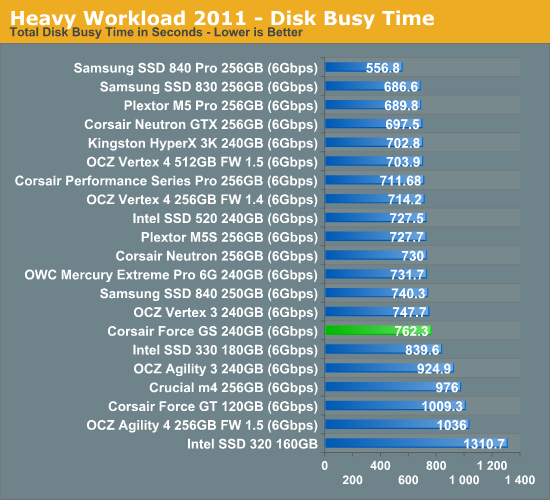
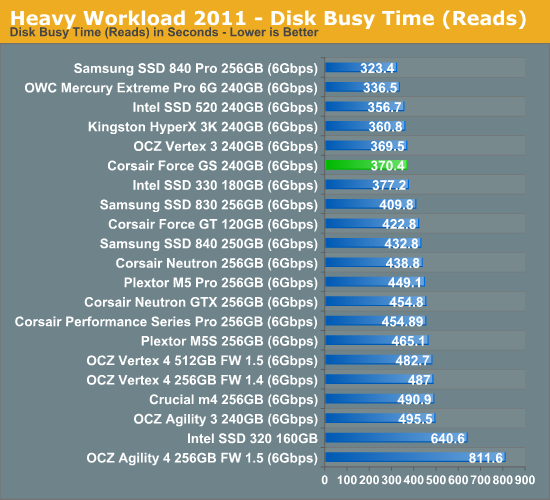
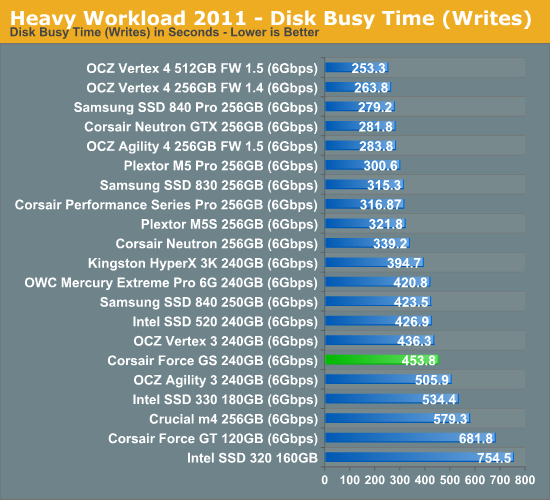
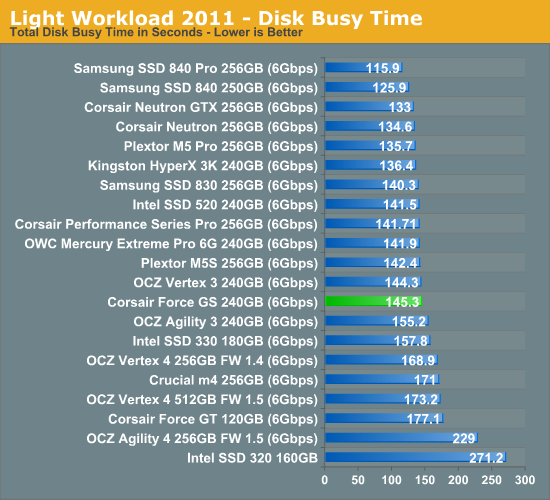
The next three charts just represent the same data, but in a different manner. Instead of looking at average data rate, we're looking at how long the disk was busy for during this entire test. Note that disk busy time excludes any and all idles; this is just how long the SSD was busy doing something:
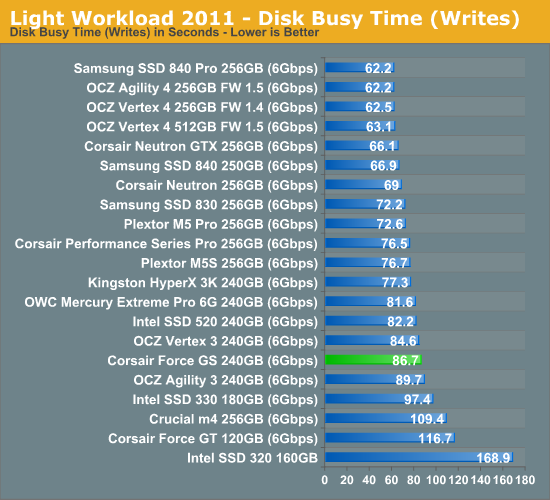
AnandTech Storage Bench 2011, Light Workload
Our new light workload actually has more write operations than read operations. The split is as follows: 372,630 reads and 459,709 writes. The relatively close read/write ratio does better mimic a typical light workload (although even lighter workloads would be far more read centric). The I/O breakdown is similar to the heavy workload at small IOs, however you'll notice that there are far fewer large IO transfers:
| AnandTech Storage Bench 2011—Light Workload IO Breakdown | ||||
| IO Size | % of Total | |||
| 4KB | 27% | |||
| 16KB | 8% | |||
| 32KB | 6% | |||
| 64KB | 5% | |||
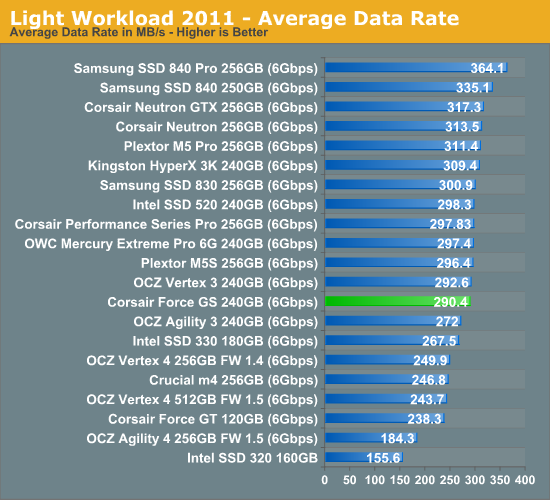
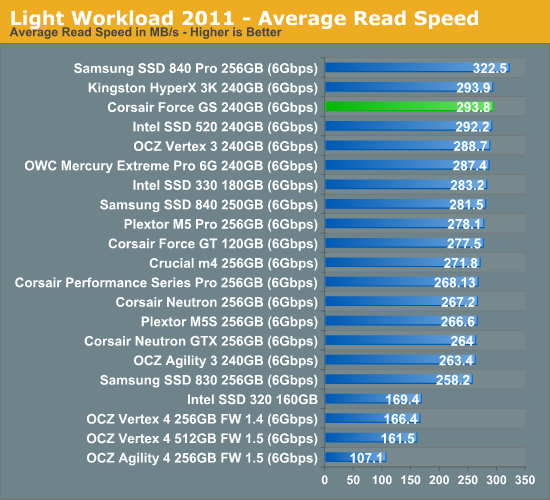
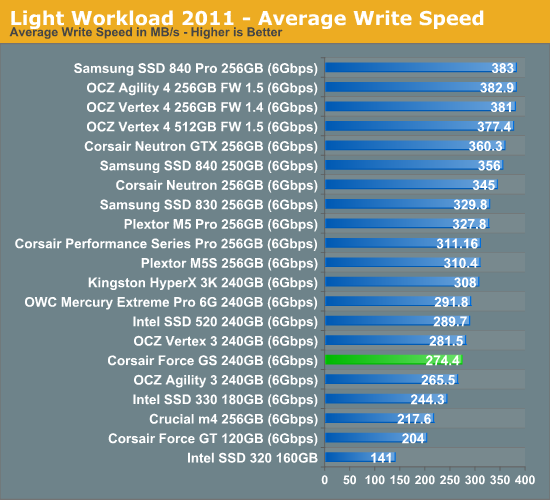
The Force GS does slightly better in our Light suite but overall its performance is average.
Power Consumption
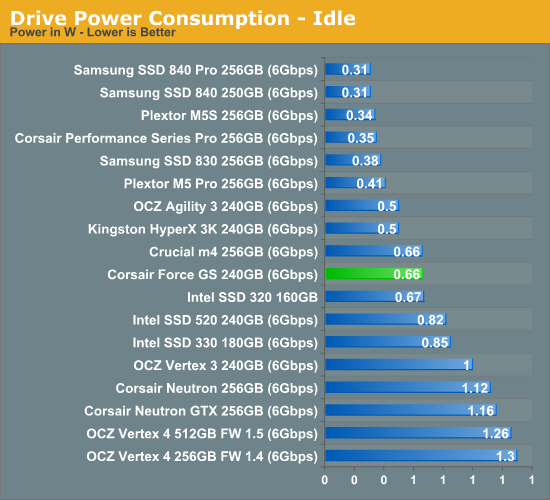
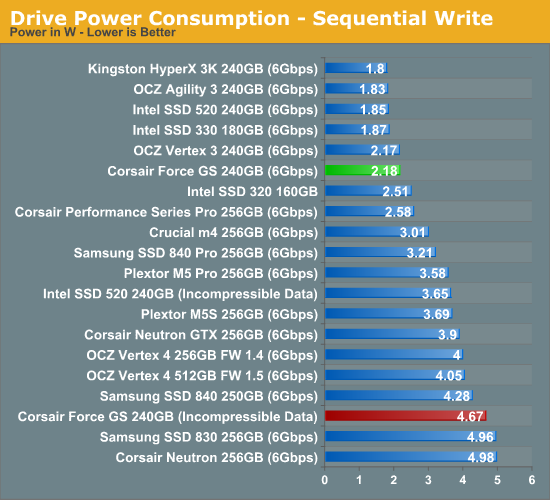
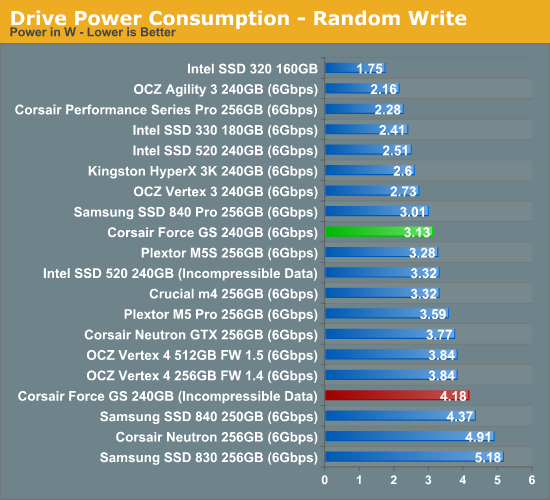
Power consumption is pretty standard SandForce. Idle power consumption has always been fairly high but load power consumption is about average, unless you're writing incompressible data which increases power consumption significantly.
Final Words
I may sound like a broken record but all SandForce SSDs except Intel's are more or less the same. While there are small variations in performance, the big picture is still alike. You have a few NAND choices but most manufacturers offer SSDs based on all different NAND choices. In this case, Toggle-Mode NAND didn't seem to bring any noticeable performance gains so the main choice you have to make is between asynchronous and synchronous/Toggle-Mode NAND. That means the only real difference between SandForce SSDs is price. If you want an advantage over other SandForce SSD OEMs, you need to price your SSDs below others' offerings.
Corsair's Force GS is reasonably priced, which makes it a good candidate if you're looking for a SandForce SSD. However, I would still follow the prices for a few days before pulling the trigger. Plextor M5S, Samsung 830, and Crucial m4 all go on sale frequently and they perform well regardless of the nature of the data. Moreover, SandForce doesn't have all that great a track record when it comes to reliability, although most issues have been fixed by now.
The Force GS has one advantage over other drives, which is the 360GB model. OCZ's Agility 3 is the only other 360GB drive at NewEgg and it's more expensive and out of stock. I can see 360GB being the sweetspot for many consumers. 240/256GB may not be enough if you want to use the SSD as your main storage but 480/512GB can be too much as well as too expensive. 360GB offers something in between: it's more than 240/256GB but noticeably cheaper than 480/512GB. We'll have to wait and see if there are any performance surprises with the 360GB model.


