Original Link: https://www.anandtech.com/show/13124/the-amd-threadripper-2990wx-and-2950x-review
The AMD Threadripper 2990WX 32-Core and 2950X 16-Core Review
by Dr. Ian Cutress on August 13, 2018 9:00 AM EST - Copya_678x452.jpg)
If you live by the workstation, you die by the performance. When it comes to processing data, throughput is key: the more a user can do, the more projects are accomplished, and the more contracts can be completed. This means that workstation users are often compute bound, and like to throw resources at the problem, be it cores, memory, storage, or graphics acceleration. AMD’s latest foray into the mix is its second generation Threadripper product, also known as Threadripper 2, which breaks the old limit on cores and pricing: the 2990WX gives 32 cores and 64 threads for only $1799. There is also the 2950X, with 16 cores and 32 threads, for a new low of $899. We tested them both.
The AMD Threadripper 2990WX 32-Core and 2950X 16-Core Review
Ever since AMD launched its first generation Ryzen product, with eight cores up against Intel’s four cores in the mainstream, the discussion has been all about how many cores makes sense. The answer to this question is entirely workload dependent – how many users have a single workload in mind, or how many will use a variety of tools simultaneously. The workstation market encompasses a wide range of distinct power users, and despite the need for speed, there is rarely a one-size fits all solution.
AMD’s first generation of Threadripper, launched in 2017, introduced 16-core processors to the masses. Previously only available on the server platforms, these new parts were priced very competitively against 10-core offerings. AMD had ultimately used its server platform, with a few tweaks, to attack a competitive landscape where Halo products are seen as king-of-the-hill.
Intel’s own workstation products, previously named E5-2687W and relied on dual socket servers, were literally that – servers. After launching its latest high-end desktop platform, with up to 18 cores, Intel then subsequently launched the Xeon W-series, which replaced the E5-W parts from the previous generation. Again, these were up to 18-cores for ~$2500, but required special chipsets and motherboards.
Today AMD is officially putting out for sale its second generation of Threadripper. These new parts attack the market two-fold: firstly by using the improved Zen+ microarchitecture, giving for a 3% IPC increase in core performance, but also using 12nm, driving up frequencies and reducing power. The second attack on the market is core count: while AMD will be replacing the 12 and 16 core processors with new Zen+ models at higher frequencies, AMD also has 24 and 32 core processors for up to $1799. When comparing 32 cores at $1799 against 18 cores at $2500, it seems like a slam dunk, right?
How AMD Enabled 32 Cores
The first generation server processor line from AMD, called EPYC, uses four silicon dies of eight cores each to hit a the full 32 core product. These parts also had eight memory channels and 128 lanes of PCIe 3.0 to play with. In order to make the first generation Threadripper processors, AMD disabled two of those silicon dies, giving only 16 cores, four memory channels, and 60 lanes of PCIe. The end product was sold focused at consumers, not server customers.
For 32 cores, AMD takes the same 32-core EPYC silicon, but upgrades it to Zen+ on 12nm for a higher frequency and lower power. However, to make it socket compatible with the first generation, it is slightly neutered: we have to go back to four memory channels and 60 lanes of PCIe. AMD wants users to think of this as an upgraded first generation product, with more cores, rather than a cut enterprise part. The easy explanation is to do with product segmentation, a tactic both companies have used over time to offer a range of products.
As a result, one way of visioning the new second generation 32-core and 24-core products is bi-modal: half the chip has access to the full resources, similar to the first generation product, while the other half of the chip doubles the same compute resources but has additional memory and PCIe latency compared to the first half. For any user that is entirely compute bound, and not memory or PCIe bound, then AMD has the product for you.
In our review, we’ll see that this bi-modal performance difference can have a significant effect, both good and bad, and is very workload dependent.
AMD’s New Product Stack
The official announcement last week showed that AMD is coming to market with four second generation Threadripper processors. Two of these will directly replace the first generation product: the 16-core 2950X will replace the 16-core 1950X, and the 12-core 2920X will replace the 12-core 1920X. These two new processors will not be bi-modal as explained above, with only two of the four silicon die on the package being active (the 16-core will be a 8+0+8+0 configuration, the 12-core is a 6+0+6+0). Sitting at the bottom of the stack will be the first generation 8-core (4+0+4+0) 1900X that also offers quad-channel memory and 60 PCIe lanes.
| 2017 | 2018 | |||
| - | $1799 | TR 2990WX | ||
| - | $1299 | TR 2970WX | ||
| TR 1950X | $999 | $899 | TR 2950X | |
| TR 1920X | $799 | $649 | TR 2920X | |
| TR 1900X | $549 | |||
The two new processors are the 32-core 2990WX and the 24-core 2970WX. They will enable four cores per complex (8+8+8+8) and three cores per complex (6+6+6+6) respectively, and are under the bi-modal nature of the memory and PCIe. The naming changes up to WX, presumably for ‘Workstation eXtreme’, but this puts the product in the same marketing line as the Radeon Pro WX family.
| AMD SKUs | |||||||
| Cores/ Threads |
Base/ Turbo |
L3 | DRAM 1DPC |
PCIe | TDP | SRP | |
| TR 2990WX | 32/64 | 3.0/4.2 | 64 MB | 4x2933 | 60 | 250 W | $1799 |
| TR 2970WX | 24/48 | 3.0/4.2 | 64 MB | 4x2933 | 60 | 250 W | $1299 |
| TR 2950X | 16/32 | 3.5/4.4 | 32 MB | 4x2933 | 60 | 180 W | $899 |
| TR 2920X | 12/24 | 3.5/4.3 | 32 MB | 4x2933 | 60 | 180 W | $649 |
| Ryzen 7 2700X | 8/16 | 3.7/4.3 | 16 MB | 2x2933 | 16 | 105 W | $329 |
The AMD Ryzen Threadripper 2990WX is the new halo product, with 32 cores and 64 threads coming in with a base frequency of 3.0 GHz and a top turbo frequency of 4.2 GHz. The idle frequency of this processor is 2.0 GHz, and when installed we saw 2.0 GHz on any core without work – it almost becomes the dominating frequency if the CPU isn’t constantly loaded. The 2990WX will be available from today and retail for $1799.
The other member of the WX series is the 2970WX, which disables one core per complex for a total of 24 cores. With similar frequencies as the 2990WX, and the same TDP, PCIe lanes, and memory support, this processor will be launched in October at the $1299 price point. With fewer cores being loaded, one might expect this processor to turbo more often than the bigger 32-core part.
For the X-series, the TR 2950X is our 16-core replacement, taking full advantage of the better frequencies that the new 12nm process can give: a base frequency of 3.5 GHz and a turbo of 4.4 GHz puts the previous generation processor to shame. In fact, the 2950X is set to be the joint highest clocked AMD Ryzen product. With that bump also comes a price drop: instead of $999 users can now get a 16-core processor for $899. The 2950X is due out at the end of the month, on August 31st.
Bringing up the rear is the 2920X, sitting in to replace the 1920X and with a similar trade-off to the other parts. As with the 2950X, the frequencies are nice and high compared to last year, with a base frequency of 3.5 GHz and a turbo of 4.3 GHz. This is all in a thermal design package of 180W. AMD told us that the TDP ratings for Threadripper 2, in general, were fairly conservative, so it will be interesting to see how they hold up. The 2920X is also out in October, going for $649 retail.
In This Review
- AMD’s New Product Stack [this page]
- Core to Core to Core: Design Trade Offs
- Precision Boost 2, Precision Boost Overdrive
- Feed Me: Infinity Fabric Requires 6x Power
- Test Setup and Comparison Points
- Our New Testing Suite for 2018 and 2019
- HEDT Benchmarks: System Tests
- HEDT Benchmarks: Rendering Tests
- HEDT Benchmarks: Office Tests
- HEDT Benchmarks: Encoding Tests
- HEDT Benchmarks: Web and Legacy Tests
- Overclocking: 4.0 GHz for 500W
- Thermal Comparisons: Remember to Remove the CPU Cooler Plastic!
- Going Up Against EPYC: Frequency vs Memory Channels
- Conclusions: Not All Cores Are Made Equal
Core to Core to Core: Design Trade Offs
AMD’s approach to these big processors is to take a small repeating unit, such as the 4-core complex or 8-core silicon die (which has two complexes on it), and put several on a package to get the required number of cores and threads. The upside of this is that there are a lot of replicated units, such as memory channels and PCIe lanes. The downside is how cores and memory have to talk to each other.
In a standard monolithic (single) silicon design, each core is on an internal interconnect to the memory controller and can hop out to main memory with a low latency. The speed between the cores and the memory controller is usually low, and the routing mechanism (a ring or a mesh) can determine bandwidth or latency or scalability, and the final performance is usually a trade-off.
In a multiple silicon design, where each die has access to specific memory locally but also has access to other memory via a jump, we then come across a non-uniform memory architecture, known in the business as a NUMA design. Performance can be limited by this abnormal memory delay, and software has to be ‘NUMA-aware’ in order to maximize both the latency and the bandwidth. The extra jumps between silicon and memory controllers also burn some power.
We saw this before with the first generation Threadripper: having two active silicon dies on the package meant that there was a hop if the data required was in the memory attached to the other silicon. With the second generation Threadripper, it gets a lot more complex.
On the left is the 1950X/2950X design, with two active silicon dies. Each die has direct access to 32 PCIe lanes and two memory channels each, which when combined gives 60/64 PCIe lanes and four memory channels. The cores that have direct access to the memory/PCIe connected to the die are faster than going off-die.
For the 2990WX and 2970WX, the two ‘inactive’ dies are now enabled, but do not have extra access to memory or PCIe. For these cores, there is no ‘local’ memory or connectivity: every access to main memory requires an extra hop. There is also extra die-to-die interconnects using AMD’s Infinity Fabric (IF), which consumes power.
The reason that these extra cores do not have direct access is down to the platform: the TR4 platform for the Threadripper processors is set at quad-channel memory and 60 PCIe lanes. If the other two dies had their memory and PCIe enabled, it would require new motherboards and memory arrangements.
Users might ask, well can we not change it so each silicon die has one memory channel, and one set of 16 PCIe lanes? The answer is that yes, this change could occur. However the platform is somewhat locked in how the pins and traces are managed on the socket and motherboards. The firmware is expecting two memory channels per die, and also for electrical and power reasons, the current motherboards on the market are not set up in this way. This is going to be an important point when get into the performance in the review, so keep this in mind.
It is worth noting that this new second generation of Threadripper and AMD’s server platform, EPYC, are cousins. They are both built from the same package layout and socket, but EPYC has all the memory channels (eight) and all the PCIe lanes (128) enabled:
Where Threadripper 2 falls down on having some cores without direct access to memory, EPYC has direct memory available everywhere. This has the downside of requiring more power, but it offers a more homogenous core-to-core traffic layout.
Going back to Threadripper 2, it is important to understand how the chip is going to be loaded. We confirmed this with AMD, but for the most part the scheduler will load up the cores that are directly attached to memory first, before using the other cores. What happens is that each core has a priority weighting, based on performance, thermals, and power – the ones closest to memory get a higher priority, however as those fill up, the cores nearby get demoted due to thermal inefficiencies. This means that while the CPU will likely fill up the cores close to memory first, it will not be a simple case of filling up all of those cores first – the system may get to 12-14 cores loaded before going out to the two new bits of silicon.
Precision Boost 2
Exact per-core turbo timings for the new processors will be determined by AMD’s voltage-frequency scaling functionality through Precision Boost 2. This feature, which we covered extensively in our Ryzen 7 2700X review, relies on available power and current to determine frequency, rather than a discrete look-up-table for voltage and frequency based on loading. Depending on the system default capabilities, the frequency and voltage will dynamically shift in order to use more of the power budget available at any point in the processor loading.
The idea is that the processor can use more of the power budget available to it than a fixed look up table that has to be consistent between all SKUs that are stamped with that number.
Precision Boost 2 also works in conjunction with XFR2 (eXtreme Frequency Range) which reacts to additional thermal headroom. If there is additional thermal budget, driven by a top-line cooler, then the processor is enabled to use more power up to the thermal limit and get additional frequency. AMD claims that a good cooler in a low ambient situation can compute >10% better in selected tests as a result of XFR2.
Ultimately this makes testing Threadripper 2 somewhat difficult. With a turbo table, performance is fixed between the different performance characteristics of each bit of silicon, making power the only differentiator. With PB2 and XF2, no two processors will perform the same. AMD has also hit a bit of a snag with these features, choosing to launch Threadripper 2 during the middle of a heatwave in Europe. Europe is famed for its lack of air conditioning everywhere, and when the ambient temperature is going above 30ºC, this will limit additional performance gains. It means that a review from a Nordic publication might see better results than one from the tropics, quite substantially.
Luckily for us we tested most of our benchmarks while in an air conditioned hotel thanks to Intel’s Data-Centric Innovation Summit which was the week before launch.
Precision Boost Overdrive
The new processors also support a feature called Precision Boost Overdrive, which looks at three key areas for power, thermal design current, and electrical design current. If any of these three areas has additional headroom, then the system will attempt to raise both the frequency and the voltage for increased performance. PBO is a mix of ‘standard’ overclocking, giving an all core boost, but gives a single core frequency uplift along with the support to still keep Precision Boost trying to raise frequency in middle-sized workloads, which is typically lost with a standard overclock. PBO also allows for idle power saving with a standard performance. PBO is enabled through Ryzen Master.
The three key areas are defined by AMD as follows:
- Package (CPU) Power, or PPT: Allowed socket power consumption permitted across the voltage rails supplying the socket
- Thermal Design Current, or TDC: The maximum current that can be delivered by the motherboard voltage regulator after warming to a steady-state temperature
- Electrical Design Current, or EDC: The maximum current that can be delivered by the motherboard voltage regulator in a peak/spike condition
By extending these limits, PBO gives rise for PB2 to have more headroom, letting PB2 push the system harder and further. PBO is quoted by AMD as supplying up to +16% performance beyond the standard.
AMD also clarifies that PBO is pushing the processor beyond the rated specifications and is an overclock: and thus any damage incurred will not be protected by warranty
StoreMI
Also available with the new Ryzen Threadripper 2 processors is StoreMI, AMD’s solution to caching by offering configurable tiered storage for users that want to mix DRAM, SSD, and HDD storage into a single unified platform. The software implementation dynamically adjusts data between up to 2GB of DRAM, up to 256 GB of SSD (NVMe or SATA), and a spinning hard drive to afford the best reading and writing experience when there isn’t enough fast storage.

AMD initially offered this software as a $20 add-on to the Ryzen APU platform, then it became free (up to a 256GB SSD) for the Ryzen 2000-series processors. That offer now extends to Threadripper. AMD’s best case scenario is citing a 90% improvement in loading times.
Feed Me: Infinity Fabric Requires More Power
When moving from a ring bus to move data between cores and the memory controllers to a mesh or chiplet system, communication between the cores gets a lot more complex. At this point each core or core subset has to act like a router, and decide the best path for the data to go if multiple hops are required to reach the intended target. As we saw with Intel’s MoDe-X mesh at the launch of Skylake-X, the key here is to both avoid contention for the best performance and reduce wire lengths to decrease power. It turns out that in these systems, the inter-core communication technique starts eating up a lot of power, and can consume more power than the cores.
To describe chip power, all consumer processors have a rated ‘TDP’, or thermal design power. Intel and AMD measure this value differently, based on workloads and temperatures, but the technical definition of TDP is the ability of the cooler to dissipate this much thermal energy when the processor is fully loaded (and usually defined at base frequency, not all-core turbo). Actual power consumption might be higher, based on losses by the power delivery, or thermal dissipation through the board, but for most situations TDP and power consumption are broadly considered equal.
This means that the TDP ratings on modern processors, such as 65W, 95W, 105W, 140W, 180W, and now 250W, should broadly indicate the peak sustained power consumption. However, as explained in the first paragraph, not all that power gets to go to pushing frequency in the cores. Some has to be used in the memory controllers, in the IO, into integrated graphics (for the chips that have them), and now the core-to-core interconnect becomes a big part of this. Just how much should be something eye-opening.
For most CPUs, we have the ability to measure either per-core or all-core power, as well as the power of the whole chip. If we subtract the 'core' power from the 'chip' power, we are left with a number of things: DRAM controller power plus interconnect power, and in some cases, L3 power as well.
To see the scale of this, let us start with something straight-forward and known to most users. Intel’s latest Coffee Lake processors, such as the Core i7-8700K, use what is known as a ring-bus design. These processors use a single ring to connect each of the cores and the memory controller – if data has to be moved, it gets placed into the ring and shuttles along to go to where it is needed. This system has historically been called the ‘Uncore’, and can run at a different frequency to the main cores, allowing for its power to scale with what is available. The power distribution looks like this:
Despite the 95W TDP, this processor at stock frequencies consumes around 125 W at load, beyond its TDP (which is defined at base frequency). However it is more the ratio of the uncore to the total power we are concerned with: at light loading, the uncore is only 4% of the total power, but that rises to 7-9% as we load up the cores. For argument, let us call this a maximum of 10%.
Now let us go into something more meaty: Intel’s Skylake-X processors. In this design, Intel uses its new ‘mesh’ architecture, similar to MoDe-X, whereby each subset of the processor has a small router / crossbar partition that can direct a data packet to the cores around it, or to itself, as required.
This design allows the processor to scale, given that ring based systems occur additional latency beyond about 14 cores or so (going by how Intel intercepted the mesh design). However, the mesh runs at a lower latency than the ring systems that Intel used to use, and they also consume a lot more power.
In this setup, we see the power that isn't for the cores starting at 20% of the total chip power, moving up to 25-30% as more cores are loaded. As a result, around one-quarter to one-third of the power on the chip is being used for core-to-core and core-to-memory communication, as well as IO. This is despite the fact that the mesh is often cited as one of the key criticisms of the performance of this processor: the benefit of being able to scale out beyond 24 processors properly is the reason why Intel has gone down this path.
For AMD, the situation is a bit mix and match. With a single four-core complex, communication between cores is relatively simple and uses a centralized crossbar. When dealing with so few cores, the communication method is simple and light. However, within two sets of complexes on the same silicon, or the memory controller, the interconnect comes into play. This is not so much a ring, but is based on an internal version of Infinity Fabric (IF).
The IF is designed to be scalable across cores, silicon, and sockets. We can probe what it does within a single piece of silicon by looking directly at the Ryzen 7 2700X, which has a TDP of 105W.
*IF Power should be 'Non-Core' power, which includes IF + DRAM controller + IO
AMD’s product here gives two interesting data points. Firstly, when the cores are weakly loaded, the IF + DRAM controller + IO accounts for a massive 43% of the total power of the processor. This is compared to 4% for the i7-8700K and 19% for the i9-7980XE. However, that 43% reduces down to around 25% of the full chip, but this is still on par with the bigger mesh based processor from Intel.
Another interesting point is that the combined non-core power doesn’t change that much scaling up the cores, going from ~17.6W to ~25.7W. For the big Intel chip, we saw it rise from ~13.8W up to beyond 40W in some cases. This brings the question as to if Intel’s offering can scale in power at the low end, and if AMD’s non-core power as an initial ‘power penalty’ to pay before the cores start getting loaded up.
With this data, let us kick it up a notch to the real story here. The Ryzen Threadripper 2950X is the updated 16-core version of Threadripper, which uses a single IF link between the two silicon dies to talk between the sets of core complexes.
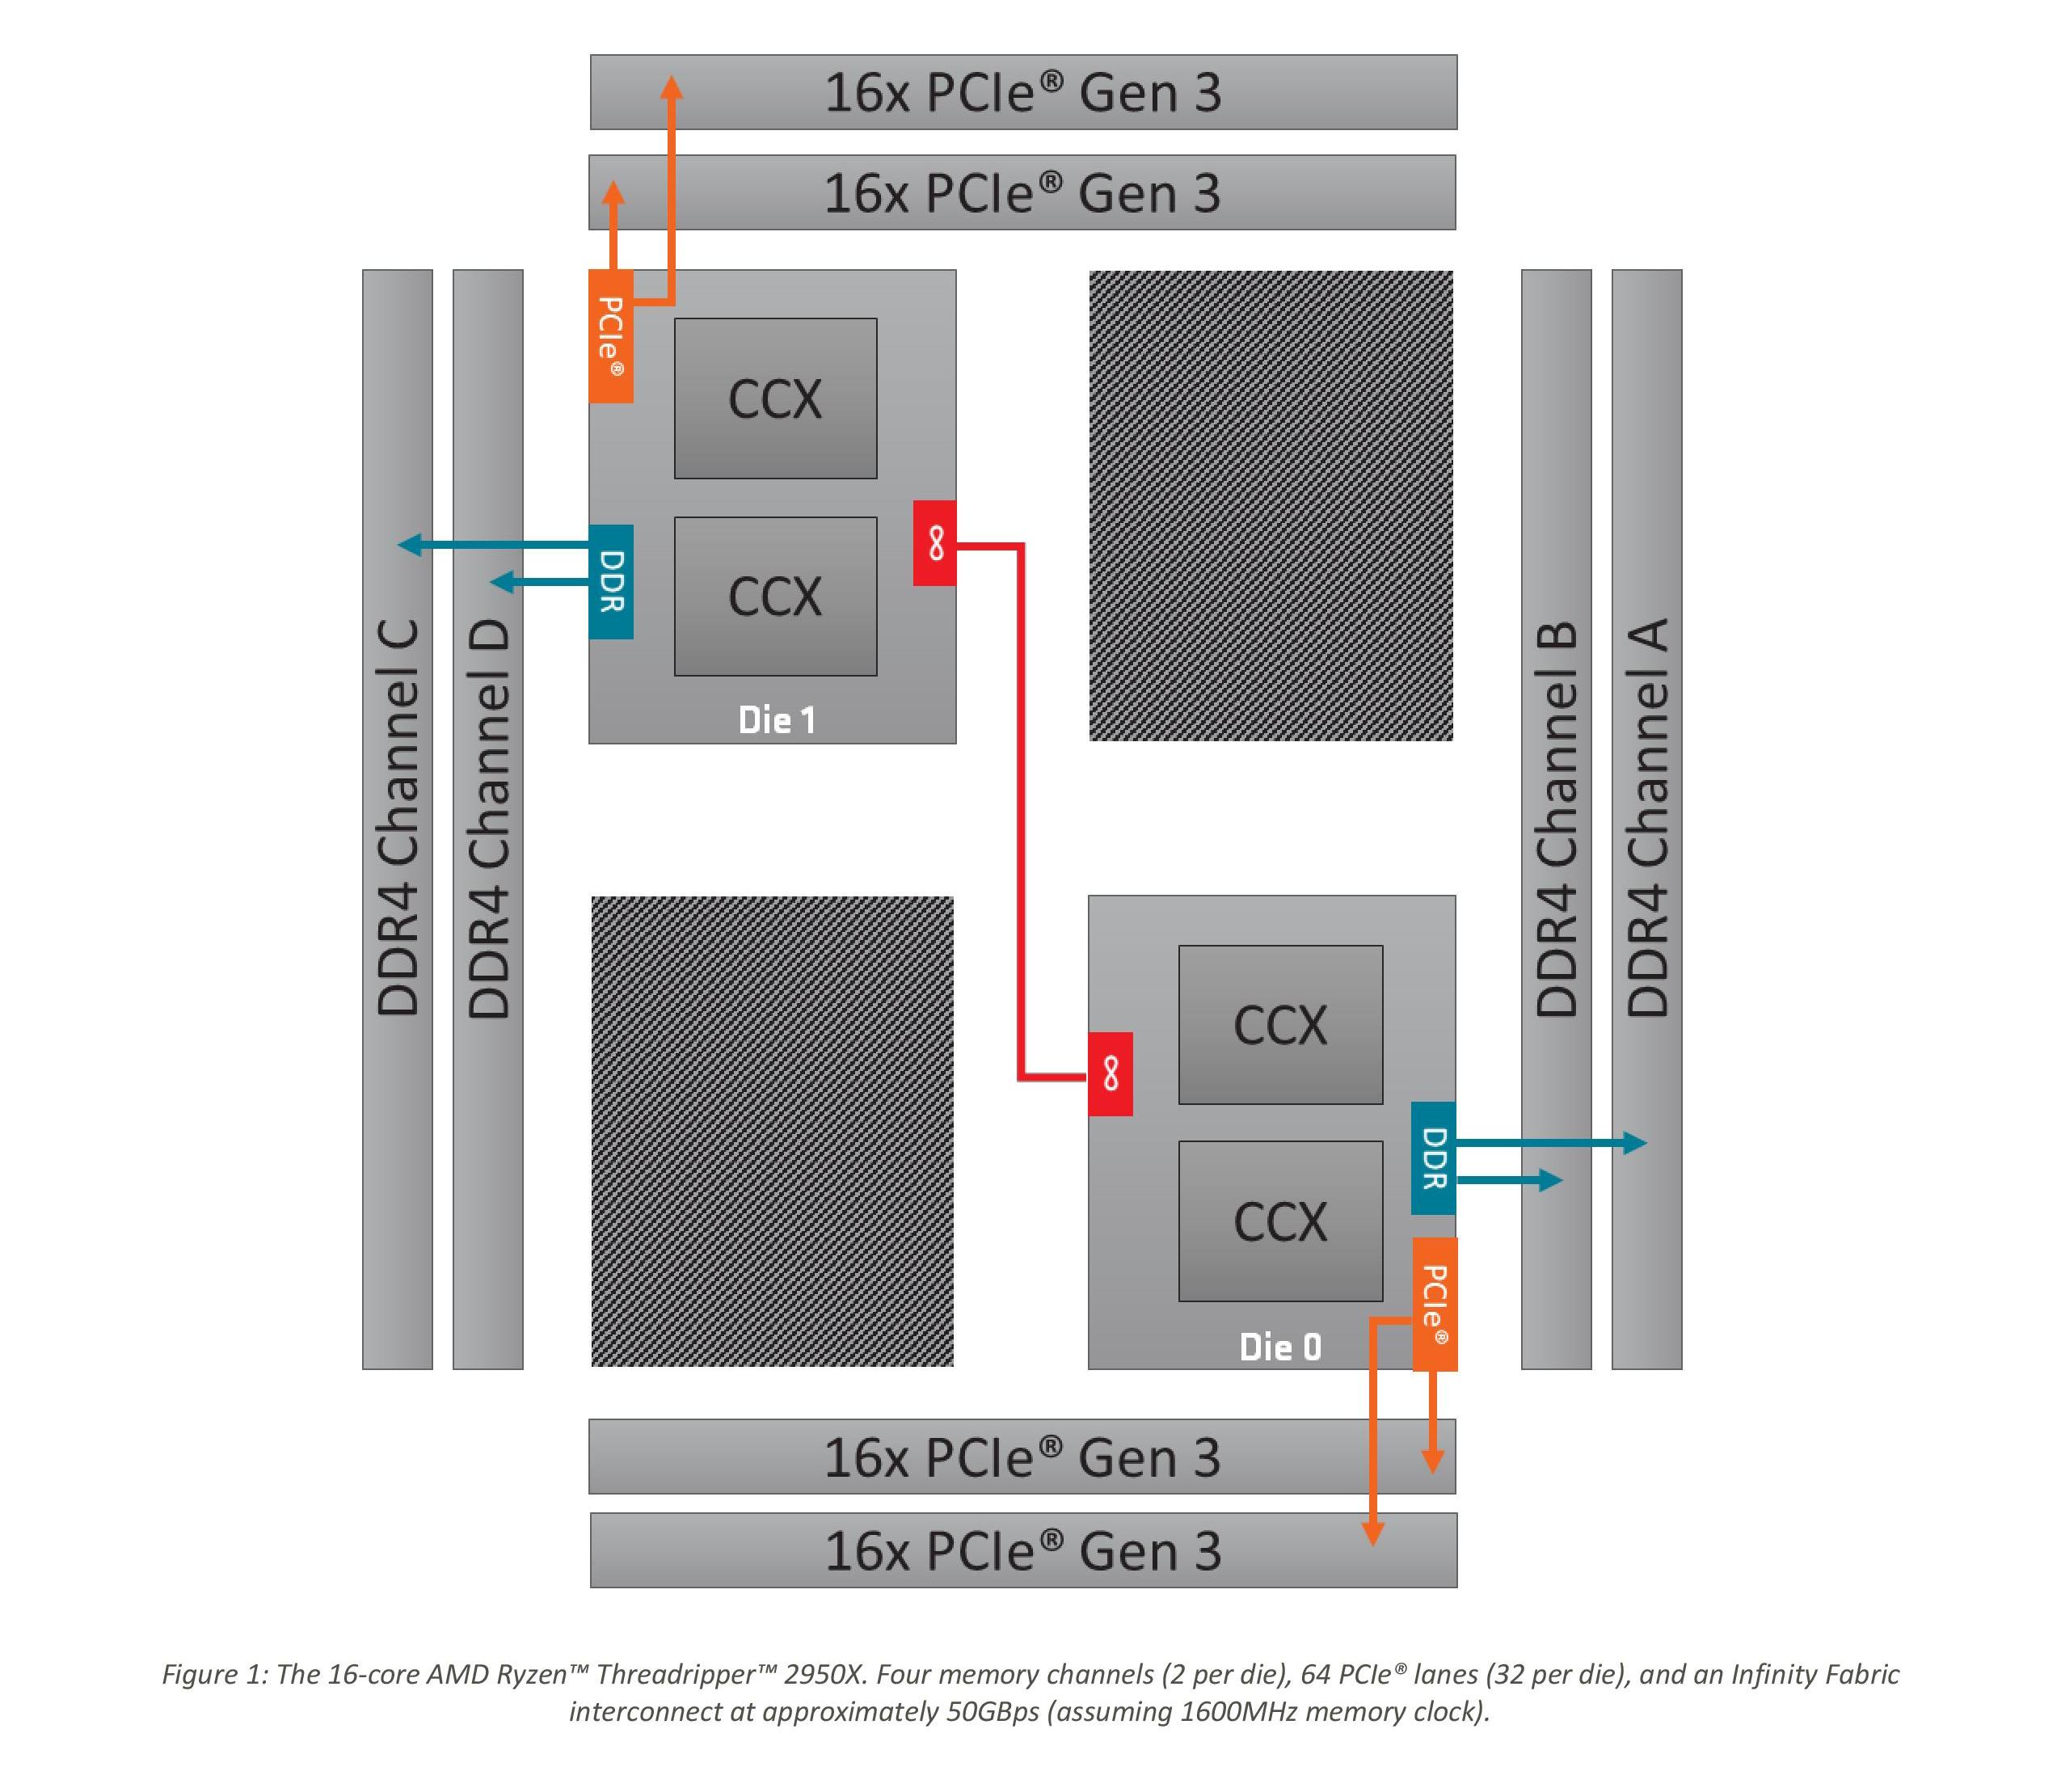
As shown on the diagram, the red line represents the IF link combined with the DRAM controller and IO. In this case, the non-core we measure includes the intra-silicon interconnect as well as the inter-silicon interconnect.
*IF Power should be 'Non-Core' power, which includes IF + DRAM controller + IO
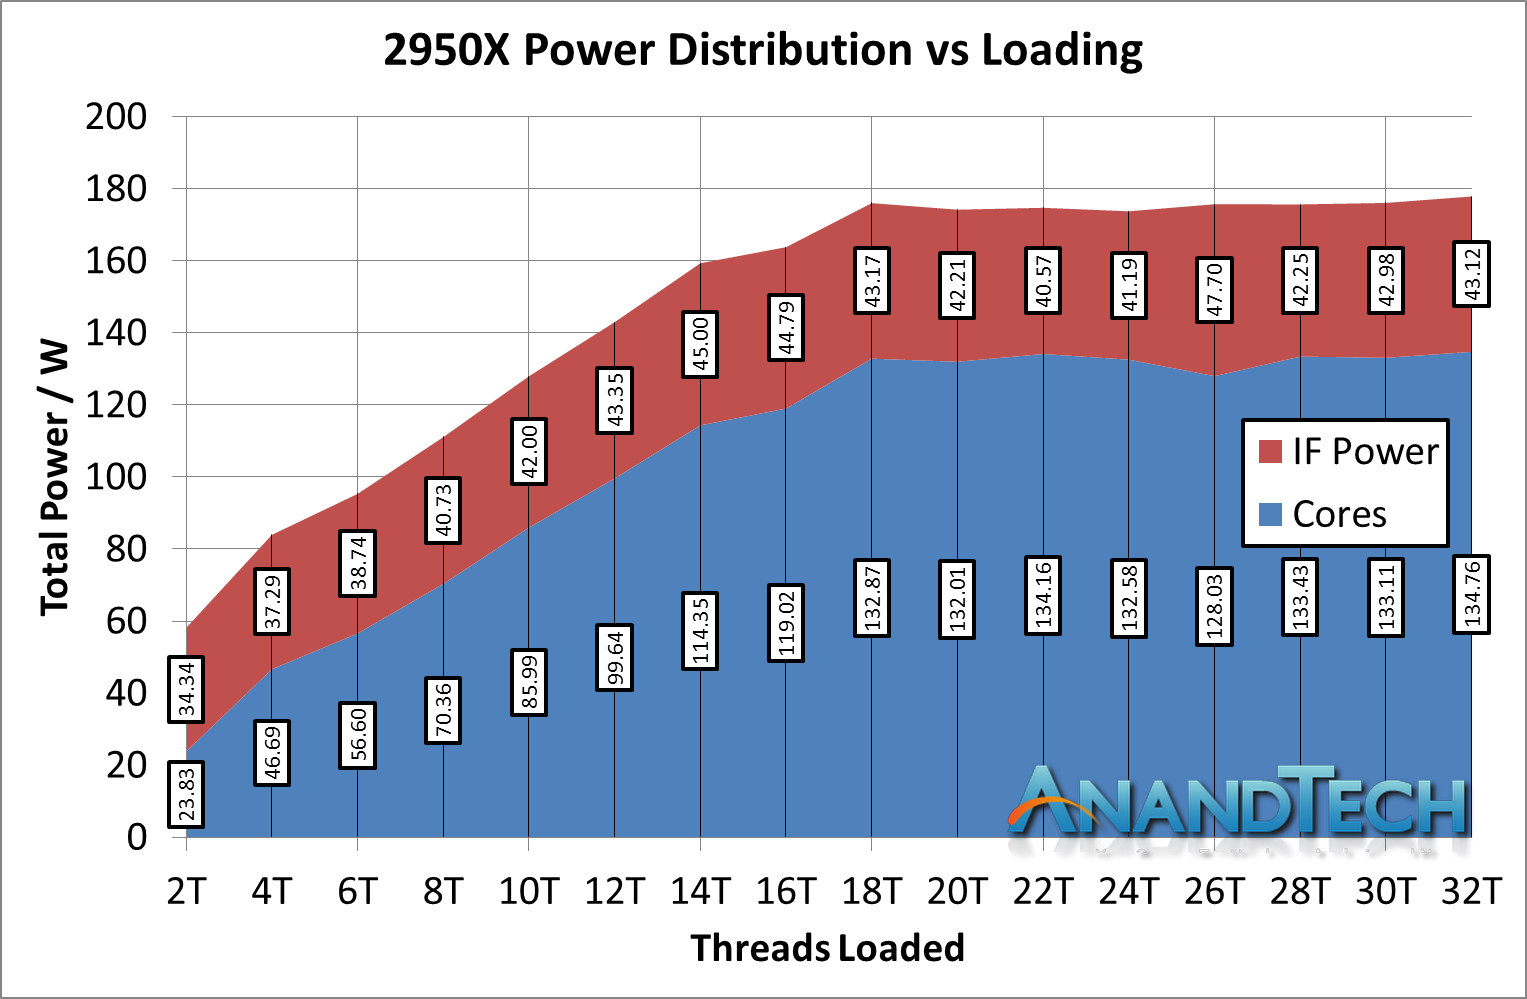
In percentage of power, the non-core power consumes 59% of the total power consumption of the chip when loaded at two threads. So even though both threads are located on the same core on the same CCX, because it needs to have access to all of the memory of the system, the die-to-die silicon link is enabled as well as the intra-silicon links are all fired up.
However, the amount of power consumed by the IF + DRAM controller + IO, as the core loading scales, does not increase all that much, from 34W to 43W, slowly reducing to around 25% of the total chip power, similar to the 2700X. It is just that initial bump that screams a lot, because of the way that that core still needs access to all the memory bandwidth available.
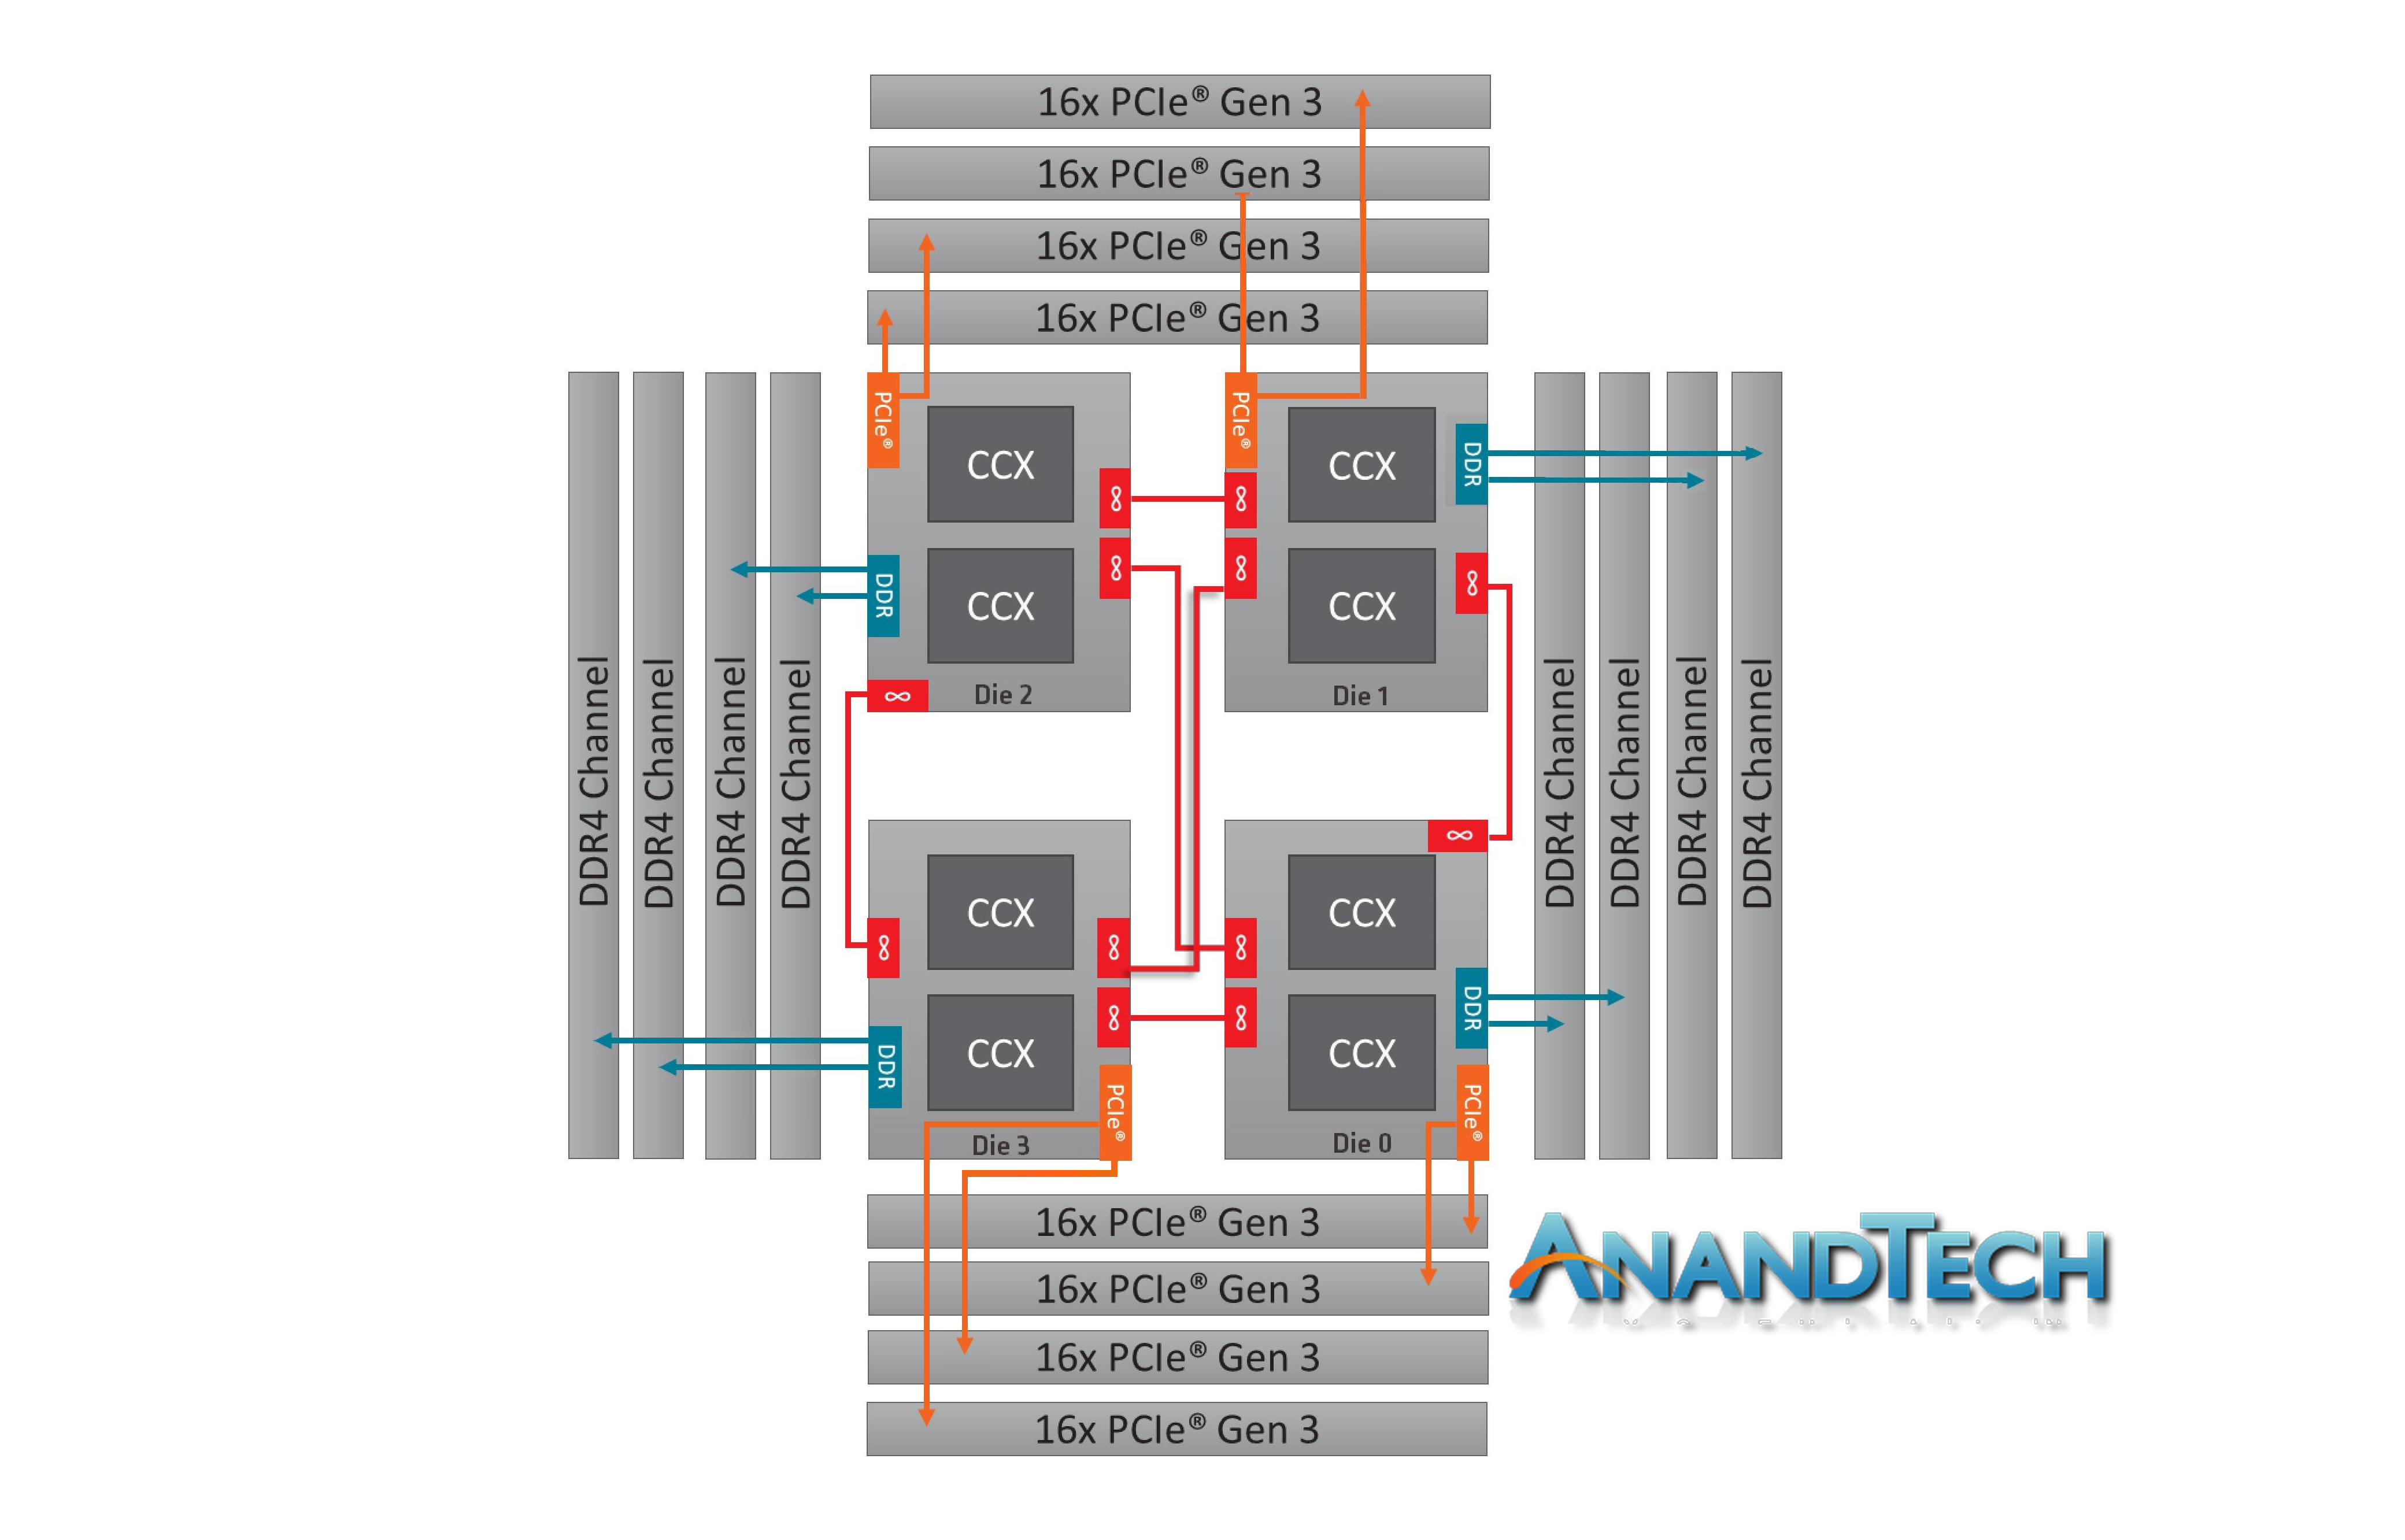
Now we should consider the 2990WX. Because all four silicon dies are enabled on the package, and each die needs an IF interconnect to each other die, there are now six IF links to fire up:
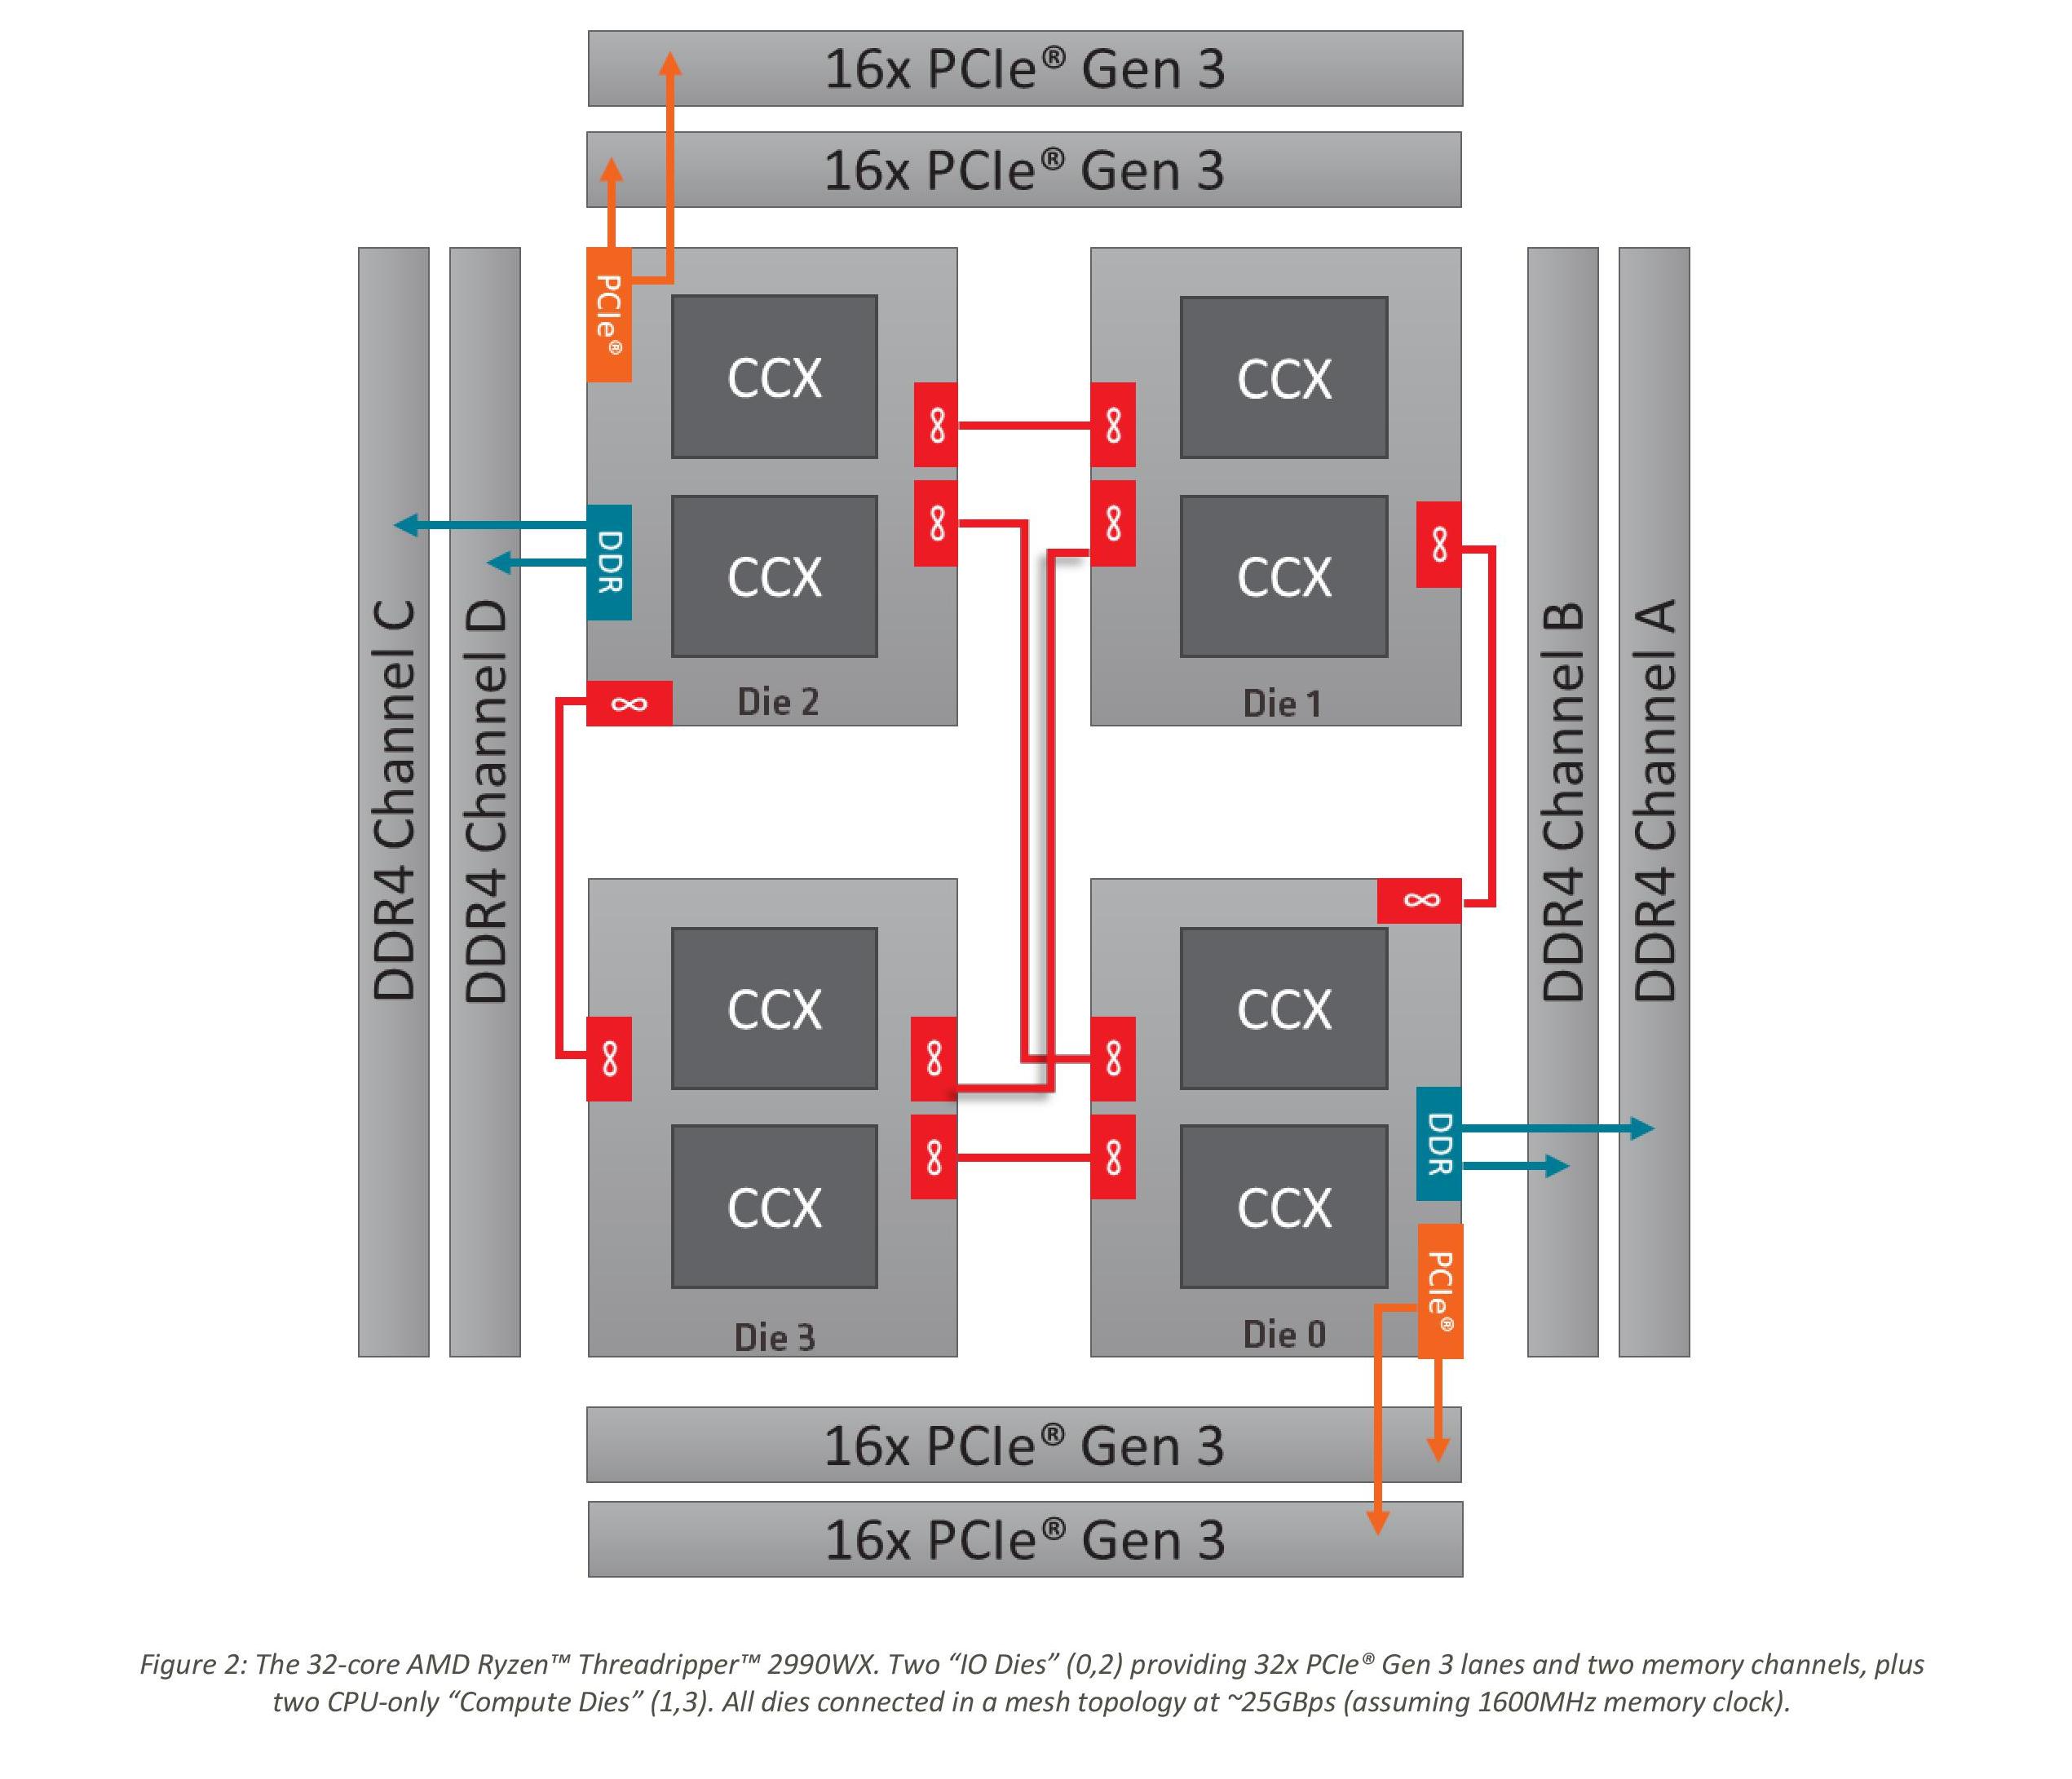
There’s a lot of red in that diagram. It is noteworthy that two of the silicon dies do not have DRAM attached to them, and so when only a few cores are enabled, theoretically AMD should be able to power down those IF links as they would only cause additional latency hops if other IF links are congested. In fact, we get something very odd indeed.
*IF Power should be 'Non-Core' power, which includes IF + DRAM controller + IO
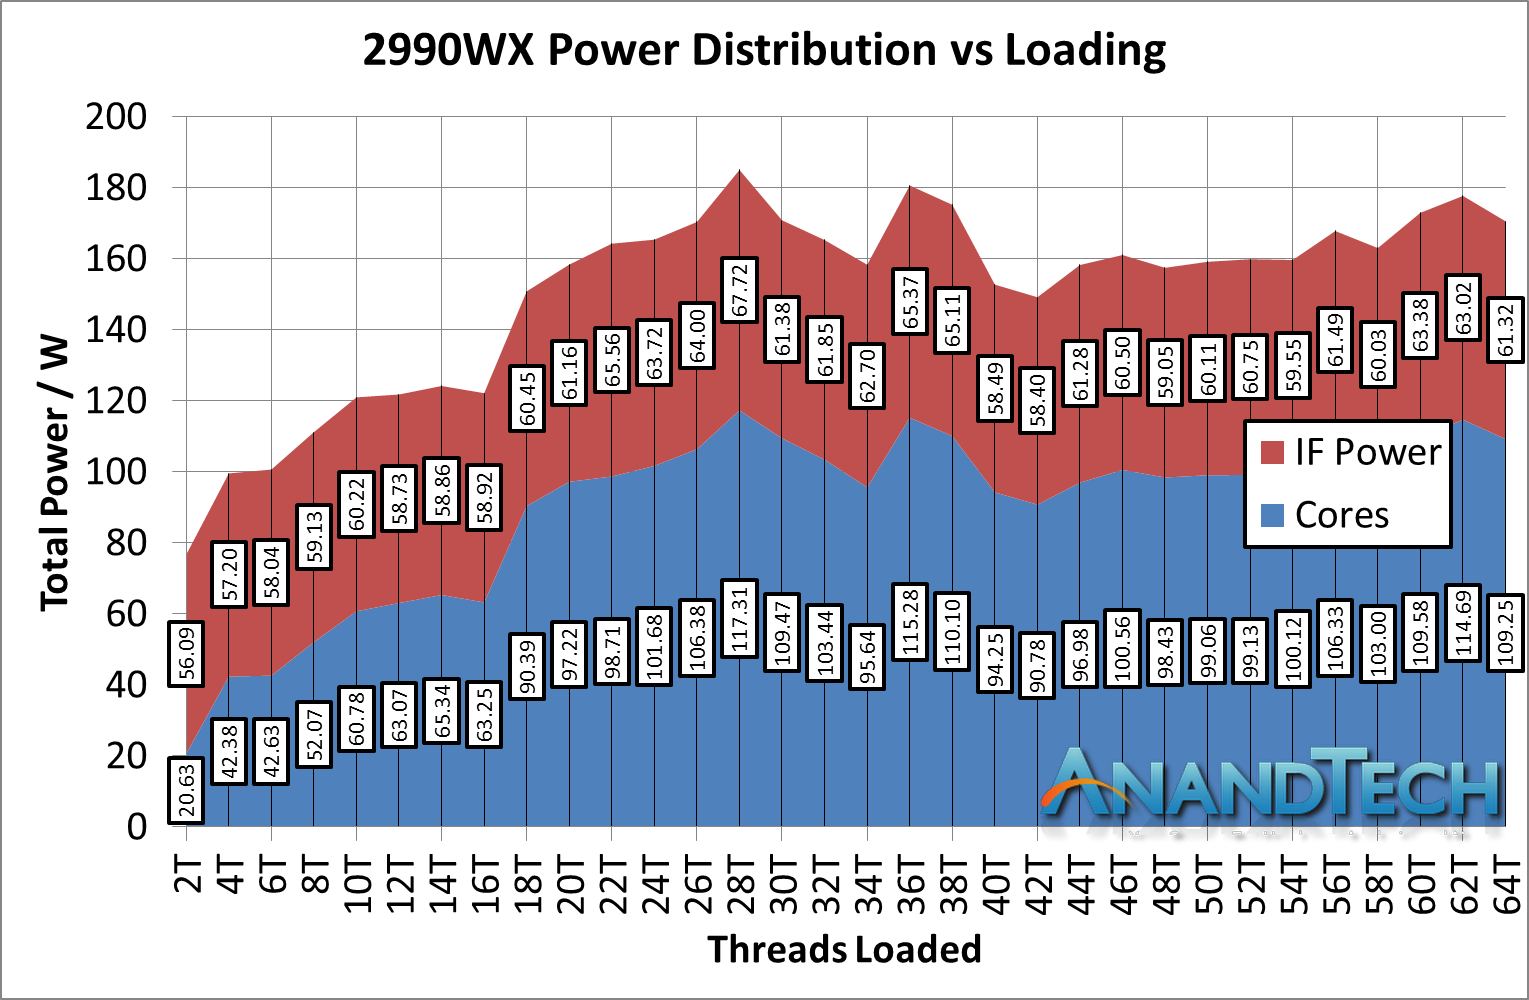
First, let us start with the low-loading metrics. Here the non-core power is consuming 56.1W from the total 76.7W power consumption, a massive 73% of the total power consumption of the processor. If a single link on the 2950W was only 34W, it is clear that the 56W here means that more than a single IF link is being fired up. There are perhaps additional power management opportunities here.
Moving through the stack, you will notice that our 2990WX sample never goes near the 250W rated TDP of the processor, actually barely hitting 180W at times. We are unsure why this is. What we can say is that as loading increases, the total contribution that the non-core power gives does decrease, slowly settling around 36%, varying between 35% and 40% depending on the specific workload. This is a rise up from the 25% we saw in the 2700X and 2950X.
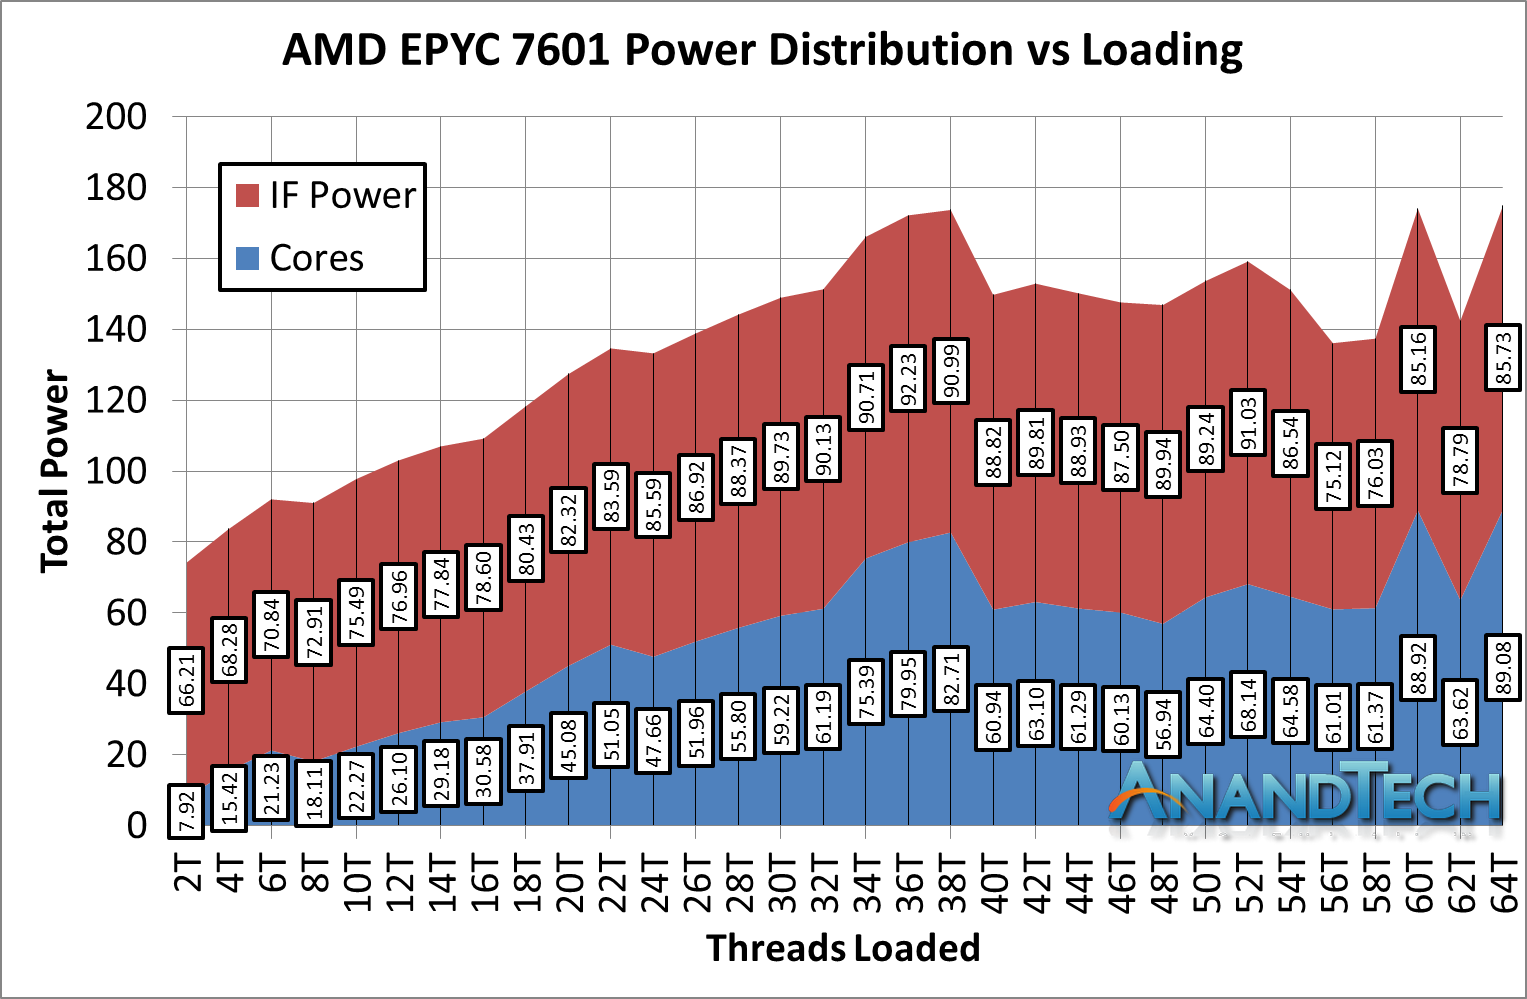
So given that this is the first review with our EPYC 7601 numbers, how about we take it up another notch? While based on the older first generation Zen cores, EPYC has additional memory controllers and IO to worry about, all of which fall under the uncore power category.
Moving into the power consumption numbers, and similar to the 2990WX as we load up all the cores, the values do get a little bit squirrely. However the proportion numbers are staggering.
*IF Power should be 'Non-Core' power, which includes IF + DRAM controller + IO
At low loading, out of a total package power of 74.1W, the non-core power consumes 66.2W, or a staggering 89% ! As we go up through the cores, that 66.2W becomes up to 90W in places, but even at its lowest point, the IF accounts for 50% of the power of the total chip. The cores are barely getting 90W out of the 180W TDP!
This raises an interesting point – if we are purely considering the academic merits of one core compared to another, does the uncore power count to that contribution? For a real-world analysis, yes, but for a purely academic one? It also means I can claim the following prophecy:
After core counts, the next battle will be on the interconnect. Low power, scalable, and high performance: process node scaling will mean nothing if the interconnect becomes 90% of the total chip power.
Test Setup and Comparison Points
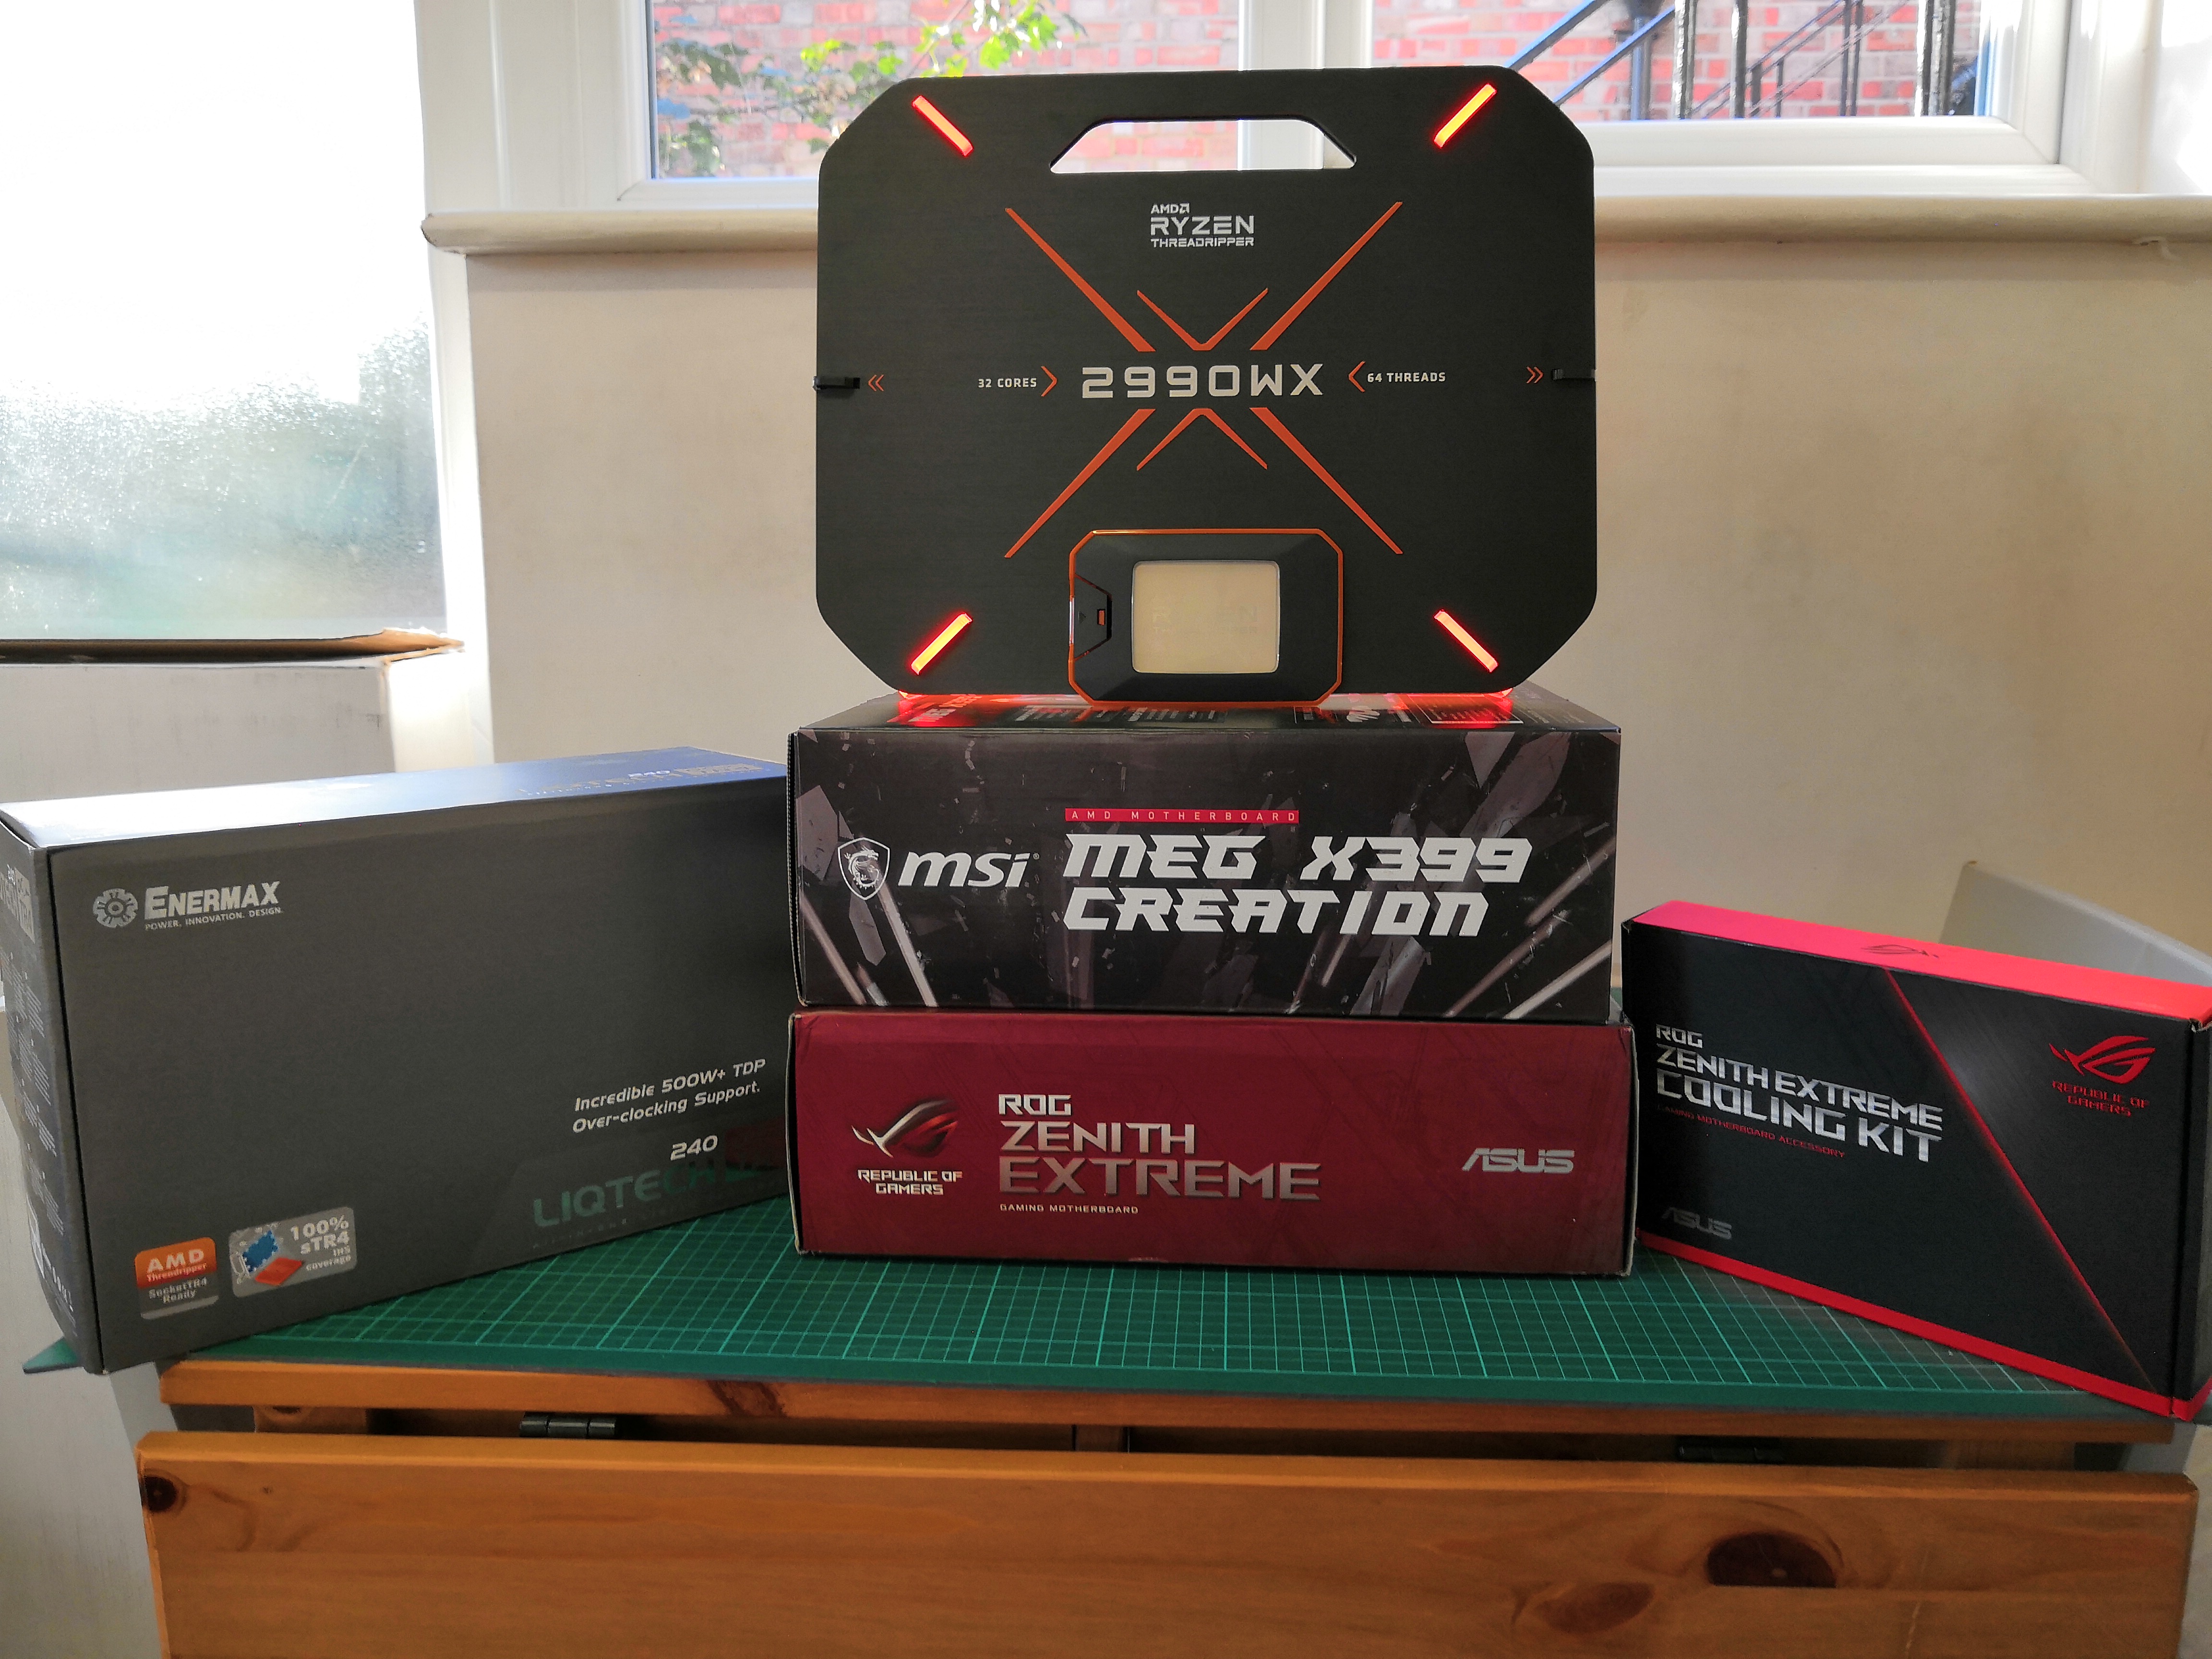
In our review kit from AMD, we were supplied with almost complete systems for testing. Inside the box of goods, AMD included:
- AMD Threadripper 2990WX (32C, 250W, $1799)
- AMD Threadripper 2950X (16C, 180W, $899)
- ASUS ROG Zenith Extreme motherboard, rev 2
- MSI X399 MEG Creation motherboard
- 4x8 GB of G.Skill FlareX DDR4-3200 14-14-14
- Wraith Ripper Cooler, co-developed with Cooler Master
- Enermax Liqtech 240 TR4 Liquid Cooler, rated to 500W
For our usual testing, we stick to the same power supplies, the same storage, ideally the same motherboard within a range of processors, and always use the latest BIOS. Despite AMD shipping us some reasonably fast memory, our standard policy is to test these systems at the maximum supported frequency as promoted by the processor manufacturer, or in this case DDR4-2933 for the new Threadripper 2000-series processors.
For our testing we compared the first generation Threadripper processors with the second generation parts. We also have the Intel 18-core Core i9-7980XE, some results from the Core i7-7900X (10-core), and also two mainstream processors, one Intel and one AMD. This is due to our new CPU testing suite, which takes effect today.
Due to an industry event occuring in the middle of our testing, we had to split some of the testing up and take 30 kg of kit half-way around the world to test in a hotel room during Flash Memory Summit. On the downside, it means there is some discontinuity in our testing, although not that much - on the plus side, the hardware tested in the hotel room had a good amount of air-conditioning to keep cool.
| AMD Test Setup | |||||
| CPUs | TR 2990WX | ASUS ROG Zenith | 0078 | Liqtech TR4 | 4x8GB DDR4-2933 |
| TR 2950X | ASUS ROG Zenith | 0078 | Liqtech TR4 | 4x8GB DDR4-2933 | |
| TR 1950X | ASUS X399-A Prime | 0806 | TRUE Cu | 4x4GB DDR4-2666 | |
| TR 1920X | ASUS ROG Zenith | 0078 | Liqtech TR4 | 4x8GB DDR4-2666 | |
| TR 1900X | ASUS X399-A Prime | 0806 | TRUE Cu | 4x4GB DDR4-2666 | |
| R7 2700X | ASUS Crosshair VI Hero | 0508 | Wraith Max | 4x8GB DDR4-2933 | |
| EPYC 7601 | GIGABYTE MZ31-AR0 | Fryzen | 8x128GB DDR4-2666 | ||
| GPU | Sapphire RX 460 2GB (CPU Tests) | ||||
| PSU | Corsair AX860i Corsair AX1200i |
||||
| SSD | Crucial MX300 1TB | ||||
| OS | Windows 10 x64 RS3 1709 Spectre and Meltdown Patched |
||||
The memory for our test suites was mostly G.Skill, with some Crucial. For the EPYC system, Micron sent us some LRDIMMs, so we fired up 1TB of memory to get all eight channels working.
On the Intel side, we are still getting up to speed on our testing.
| Intel Test Setup | |||||
| CPUs | i9-7980XE | ASRock X299 OC Formula | P1.40 | TRUE Cu | 4x8GB DDR4-2666 |
| i9-7900X | ASRock X299 OC Formula | P1.40 | TRUE Cu | 4x8GB DDR4-2666 | |
| i7-8700K | ASRock Z370 Gaming i7 | P1.70 | AR10-115XS | 4x4GB DDR4-2666 | |
| GPU | Sapphire RX 460 2GB (CPU Tests) | ||||
| PSU | Corsair AX860i Corsair AX1200i |
||||
| SSD | Crucial MX300 1TB | ||||
| OS | Windows 10 x64 RS3 1709 Spectre and Meltdown Patched |
||||
Over time we will be adding to our Intel CPUs tested.
Many thanks to...
We must thank the following companies for kindly providing hardware for our multiple test beds. Some of this hardware is not in this test bed specifically, but is used in other testing.
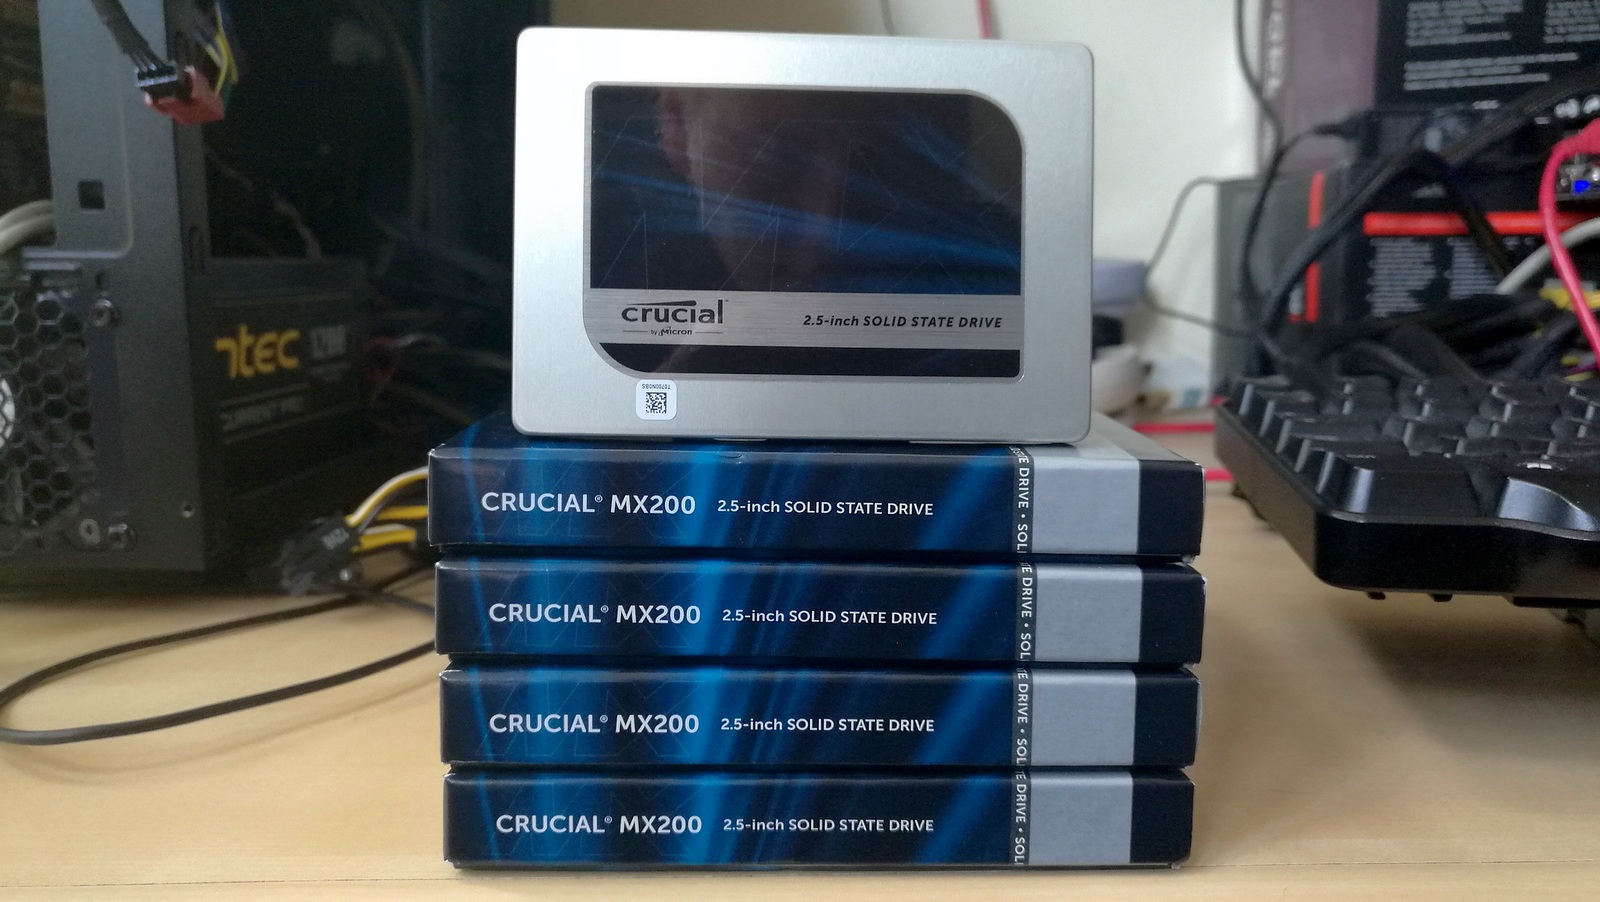
Thank you to Crucial for providing us with MX200 SSDs and to Micron for LRDIMMs. Crucial stepped up to the plate as our benchmark list grows larger with newer benchmarks and titles, and the 1TB MX200 units are strong performers. Based on Marvell's 88SS9189 controller and using Micron's 16nm 128Gbit MLC flash, these are 7mm high, 2.5-inch drives rated for 100K random read IOPs and 555/500 MB/s sequential read and write speeds. The 1TB models we are using here support TCG Opal 2.0 and IEEE-1667 (eDrive) encryption and have a 320TB rated endurance with a three-year warranty.
Further Reading: AnandTech's Crucial MX200 (250 GB, 500 GB & 1TB) Review
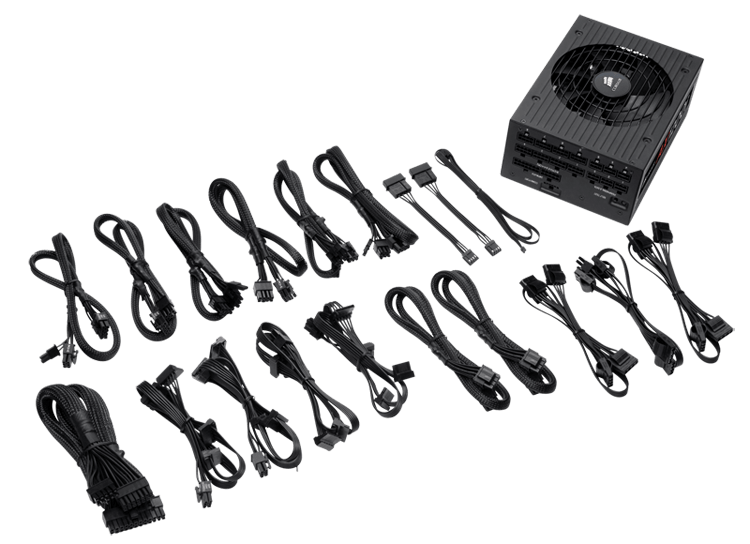
Thank you to Corsair for providing us with an AX1200i PSU. The AX1200i was the first power supply to offer digital control and management via Corsair's Link system, but under the hood it commands a 1200W rating at 50C with 80 PLUS Platinum certification. This allows for a minimum 89-92% efficiency at 115V and 90-94% at 230V. The AX1200i is completely modular, running the larger 200mm design, with a dual ball bearing 140mm fan to assist high-performance use. The AX1200i is designed to be a workhorse, with up to 8 PCIe connectors for suitable four-way GPU setups. The AX1200i also comes with a Zero RPM mode for the fan, which due to the design allows the fan to be switched off when the power supply is under 30% load.
Further Reading: AnandTech's Corsair AX1500i Power Supply Review
Thank you to G.Skill for providing us with memory. G.Skill has been a long-time supporter of AnandTech over the years, for testing beyond our CPU and motherboard memory reviews. We've reported on their high capacity and high-frequency kits, and every year at Computex G.Skill holds a world overclocking tournament with liquid nitrogen right on the show floor.
Further Reading: AnandTech's Memory Scaling on Haswell Review, with G.Skill DDR3-3000
Our New Testing Suite for 2018 and 2019
Spectre and Meltdown Hardened
In order to keep up to date with our testing, we have to update our software every so often to stay relevant. In our updates we typically implement the latest operating system, the latest patches, the latest software revisions, the newest graphics drivers, as well as add new tests or remove old ones. As regular readers will know, our CPU testing revolves an automated test suite, and depending on how the newest software works, the suite either needs to change, be updated, have tests removed, or be rewritten completely. Last time we did a full re-write, it took the best part of a month, including regression testing (testing older processors).
One of the key elements of our testing update for 2018 (and 2019) is the fact that our scripts and systems are designed to be hardened for Spectre and Meltdown. This means making sure that all of our BIOSes are updated with the latest microcode, and all the steps are in place with our operating system with updates. In this case we are using Windows 10 x64 Enterprise 1709 with April security updates which enforces Smeltdown (our combined name) mitigations. Uses might ask why we are not running Windows 10 x64 RS4, the latest major update – this is due to some new features which are giving uneven results. Rather than spend a few weeks learning to disable them, we’re going ahead with RS3 which has been widely used.
Our previous benchmark suite was split into several segments depending on how the test is usually perceived. Our new test suite follows similar lines, and we run the tests based on:
- Power
- Memory
- Office
- System
- Render
- Encoding
- Web
- Legacy
- Linux
- Integrated Gaming
- CPU Gaming
Depending on the focus of the review, the order of these benchmarks might change, or some left out of the main review. All of our data will reside in our benchmark database, Bench, for which there is a new ‘CPU 2019’ section for all of our new tests.
Within each section, we will have the following tests:
Power
Our power tests consist of running a substantial workload for every thread in the system, and then probing the power registers on the chip to find out details such as core power, package power, DRAM power, IO power, and per-core power. This all depends on how much information is given by the manufacturer of the chip: sometimes a lot, sometimes not at all.
We are currently running Prime95 as our main test, however we are recently playing with POV-Ray as well.
Memory
These tests involve disabling all turbo modes in the system, forcing it to run at base frequency, and them implementing both a memory latency checker (Intel’s Memory Latency Checker works equally well for both platforms) and AIDA64 to probe cache bandwidth.
Office
- Chromium Compile: Windows VC++ Compile of Chrome 56 (same as 2017)
- PCMark10: Primary data will be the overview results – subtest results will be in Bench
- 3DMark Physics: We test every physics sub-test for Bench, and report the major ones (new)
- GeekBench4: By request (new)
- SYSmark 2018: Recently released by BAPCo, currently automating it into our suite (new)
System
- Application Load: Time to load GIMP 2.10.4 (new)
- FCAT: Time to process a 90 second ROTR 1440p recording (same as 2017)
- 3D Particle Movement: Particle distribution test (same as 2017) – we also have AVX2 and AVX512 versions of this, which may be added later
- Dolphin 5.0: Console emulation test (same as 2017)
- DigiCortex: Sea Slug Brain simulation (same as 2017)
- y-Cruncher v0.7.6: Pi calculation with optimized instruction sets for new CPUs (new)
- Agisoft Photoscan 1.3.3: 2D image to 3D modelling tool (updated)
Render
- Corona 1.3: Performance renderer for 3dsMax, Cinema4D (same as 2017)
- Blender 2.79b: Render of bmw27 on CPU (updated to 2.79b)
- LuxMark v3.1 C++ and OpenCL: Test of different rendering code paths (same as 2017)
- POV-Ray 3.7.1: Built-in benchmark (updated)
- CineBench R15: Older Cinema4D test, will likely remain in Bench (same as 2017)
Encoding
- 7-zip 1805: Built-in benchmark (updated to v1805)
- WinRAR 5.60b3: Compression test of directory with video and web files (updated to 5.60b3)
- AES Encryption: In-memory AES performance. Slightly older test. (same as 2017)
- Handbrake 1.1.0: Logitech C920 1080p60 input file, transcoded into three formats for streaming/storage:
- 720p60, x264, 6000 kbps CBR, Fast, High Profile
- 1080p60, x264, 3500 kbps CBR, Faster, Main Profile
- 1080p60, HEVC, 3500 kbps VBR, Fast, 2-Pass Main Profile
Web
- WebXPRT3: The latest WebXPRT test (updated)
- WebXPRT15: Similar to 3, but slightly older. (same as 2017)
- Speedometer2: Javascript Framework test (new)
- Google Octane 2.0: Depreciated but popular web test (same as 2017)
- Mozilla Kraken 1.1: Depreciated but popular web test (same as 2017)
Legacy (same as 2017)
- 3DPM v1: Older version of 3DPM, very naïve code
- x264 HD 3.0: Older transcode benchmark
- Cinebench R11.5 and R10: Representative of different coding methodologies
Linux
When in full swing, we wish to return to running LinuxBench 1.0. This was in our 2016 test, but was ditched in 2017 as it added an extra complication layer to our automation. By popular request, we are going to run it again.
Integrated and CPU Gaming
We are in the process of automating around a dozen games at four different performance levels. A good number of games will have frame time data, however due to automation complications, some will not. The idea is that we get a good overview of a number of different genres and engines for testing. So far we have the following games automated:
- World of Tanks, encore (standalone benchmark)
- Final Fantasy XV (standalone benchmark, standard detail to avoid overdraw)
- Far Cry 5
- Shadow of War
- GTA5
- F1 2017
- Civilization 6
- Car Mechanic Simulator 2018
We are also in the process of testing the following for automation, with varying success:
- Ashes of the Singularity: Classic (is having issues with command line)
- Total War: Thrones of Britannia (will not accept mouse input when loaded)
- Deus Ex: Mankind Divided (current test not portable, might be Denuvo limited)
- Steep For Honor
- Ghost Recon
For our CPU Gaming tests, we will be running on an NVIDIA GTX 1080. For the CPU benchmarks, we use an RX460 as we now have several units for concurrent testing.
In previous years we tested multiple GPUs on a small number of games – this time around, due to a Twitter poll I did which turned out exactly 50:50, we are doing it the other way around: more games, fewer GPUs.
Scale Up vs Scale Out: Benefits of Automation
One comment we get every now and again is that automation isn’t the best way of testing – there’s a higher barrier to entry, and it limits the tests that can be done. From our perspective, despite taking a little while to program properly (and get it right), automation means we can do several things:
- Guarantee consistent breaks between tests for cooldown to occur, rather than variable cooldown times based on ‘if I’m looking at the screen’
- It allows us to simultaneously test several systems at once. I currently run five systems in my office (limited by the number of 4K monitors, and space) which means we can process more hardware at the same time
- We can leave tests to run overnight, very useful for a deadline
- With a good enough script, tests can be added very easily
Our benchmark suite collates all the results and spits out data as the tests are running to a central storage platform, which I can probe mid-run to update data as it comes through. This also acts as a mental check in case any of the data might be abnormal.
We do have one major limitation, and that rests on the side of our gaming tests. We are running multiple tests through one Steam account, some of which (like GTA) are online only. As Steam only lets one system play on an account at once, our gaming script probes Steam’s own APIs to determine if we are ‘online’ or not, and to run offline tests until the account is free to be logged in on that system. Depending on the number of games we test that absolutely require online mode, it can be a bit of a bottleneck.
Benchmark Suite Rollout
This will be the first review with our new benchmark suite, at least the CPU portion of it. We are still working on the new gaming suite. So far for this review we tested 8-9 processors, and I am expecting to iron out any inconsistencies further into September, after several key industry events over the next few weeks.
As always, we do take requests. It helps us understand the workloads that everyone is running and plan accordingly.
A side note on software packages: we have had requests for tests on software such as ANSYS, or other professional grade software. The downside of testing this software is licensing and scale. Most of these companies do not particularly care about us running tests, and state it’s not part of their goals. Others, like Agisoft, are more than willing to help. If you are involved in these software packages, the best way to see us benchmark them is to reach out. We have special versions of software for some of our tests, and if we can get something that works, and relevant to the audience, then we shouldn’t have too much difficulty adding it to the suite.
HEDT Benchmarks: System Tests
Our System Test section focuses significantly on real-world testing, user experience, with a slight nod to throughput. In this section we cover application loading time, image processing, simple scientific physics, emulation, neural simulation, optimized compute, and 3d model development, with a combination of readily available and custom software. For some of these tests, the bigger suites such as PCMark do cover them (we publish those values in our office section), although multiple perspectives is always beneficial. In all our tests we will explain in-depth what is being tested, and how we are testing.
Application Load: GIMP 2.10.4
One of the most important aspects about user experience and workflow is how fast does a system respond. A good test of this is to see how long it takes for an application to load. Most applications these days, when on an SSD, load fairly instantly, however some office tools require asset pre-loading before being available. Most operating systems employ caching as well, so when certain software is loaded repeatedly (web browser, office tools), then can be initialized much quicker.
In our last suite, we tested how long it took to load a large PDF in Adobe Acrobat. Unfortunately this test was a nightmare to program for, and didn’t transfer over to Win10 RS3 easily. In the meantime we discovered an application that can automate this test, and we put it up against GIMP, a popular free open-source online photo editing tool, and the major alternative to Adobe Photoshop. We set it to load a large 50MB design template, and perform the load 10 times with 10 seconds in-between each. Due to caching, the first 3-5 results are often slower than the rest, and time to cache can be inconsistent, we take the average of the last five results to show CPU processing on cached loading.
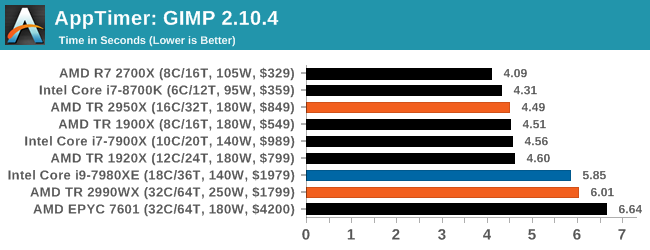
This benchmark has neatly fallen into two categories: mostly lower core count processors on one side, and the high-end desktop on the other. The 1920X and 2950X are quick, while Intel’s 18-core and the 32-core parts are slower. This is likely due to the bigger differential in single core performance, however I suspect that some of the memory latency might also be a factor here.
FCAT: Image Processing
The FCAT software was developed to help detect microstuttering, dropped frames, and run frames in graphics benchmarks when two accelerators were paired together to render a scene. Due to game engines and graphics drivers, not all GPU combinations performed ideally, which led to this software fixing colors to each rendered frame and dynamic raw recording of the data using a video capture device.
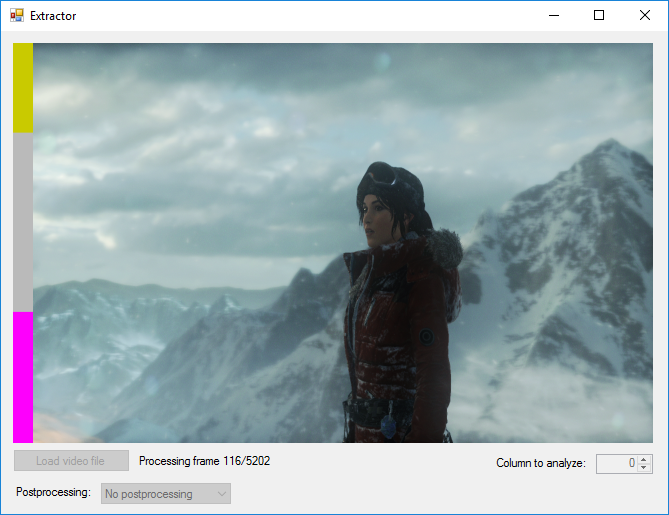
The FCAT software takes that recorded video, which in our case is 90 seconds of a 1440p run of Rise of the Tomb Raider, and processes that color data into frame time data so the system can plot an ‘observed’ frame rate, and correlate that to the power consumption of the accelerators. This test, by virtue of how quickly it was put together, is single threaded. We run the process and report the time to completion.
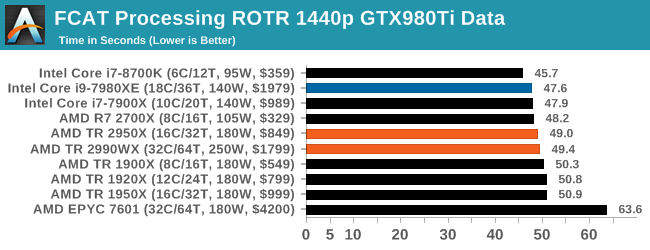
All our systems perform similarly, however Intel’s faster single threaded performance puts its processors in the lead here. The EPYC 7601 sits out back with its low single core frequency.
3D Particle Movement v2.1: Brownian Motion
Our 3DPM test is a custom built benchmark designed to simulate six different particle movement algorithms of points in a 3D space. The algorithms were developed as part of my PhD., and while ultimately perform best on a GPU, provide a good idea on how instruction streams are interpreted by different microarchitectures.
A key part of the algorithms is the random number generation – we use relatively fast generation which ends up implementing dependency chains in the code. The upgrade over the naïve first version of this code solved for false sharing in the caches, a major bottleneck. We are also looking at AVX2 and AVX512 versions of this benchmark for future reviews.
For this test, we run a stock particle set over the six algorithms for 20 seconds apiece, with 10 second pauses, and report the total rate of particle movement, in millions of operations (movements) per second.
3DPM v2.1 can be downloaded from our server: 3DPMv2.1.rar (13.0 MB)
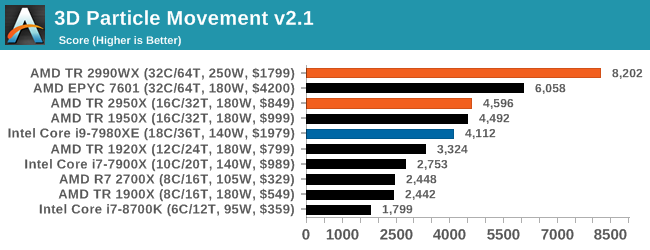
It would appear that 3DPM loves threads and frequency, with the top four spots going to AMD. Even last generation’s 16-core outperforms Intel’s 18-core in this test using non-AVX instructions. An interesting comparison here is between the 2990WX and the EPYC 7601 – the extra frequency on the consumer processor helps drive an extra 30%+ performance.
Dolphin 5.0: Console Emulation
One of the popular requested tests in our suite is to do with console emulation. Being able to pick up a game from an older system and run it as expected depends on the overhead of the emulator: it takes a significantly more powerful x86 system to be able to accurately emulate an older non-x86 console, especially if code for that console was made to abuse certain physical bugs in the hardware.
For our test, we use the popular Dolphin emulation software, and run a compute project through it to determine how close to a standard console system our processors can emulate. In this test, a Nintendo Wii would take around 1050 seconds.
The latest version of Dolphin can be downloaded from https://dolphin-emu.org/
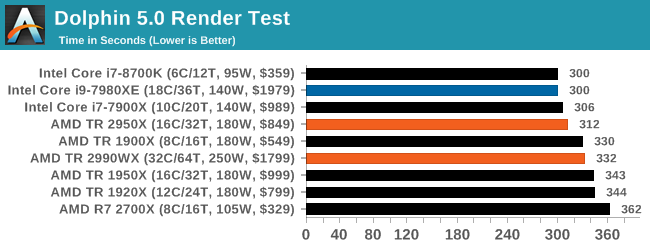
Dolphin is typically governed by single threaded performance, so Intel sits at the front here again, although having the R7 2700X at the end seems a little odd. On the off chance that this is a freak result, I should run this test again. However on the second generation TR parts, the higher clock frequency of the 2950X puts it ahead of the 2990WX by a good 20 seconds.
DigiCortex 1.20: Sea Slug Brain Simulation
This benchmark was originally designed for simulation and visualization of neuron and synapse activity, as is commonly found in the brain. The software comes with a variety of benchmark modes, and we take the small benchmark which runs a 32k neuron / 1.8B synapse simulation, equivalent to a Sea Slug.

Example of a 2.1B neuron simulation
We report the results as the ability to simulate the data as a fraction of real-time, so anything above a ‘one’ is suitable for real-time work. Out of the two modes, a ‘non-firing’ mode which is DRAM heavy and a ‘firing’ mode which has CPU work, we choose the latter. Despite this, the benchmark is still affected by DRAM speed a fair amount.
DigiCortex can be downloaded from http://www.digicortex.net/
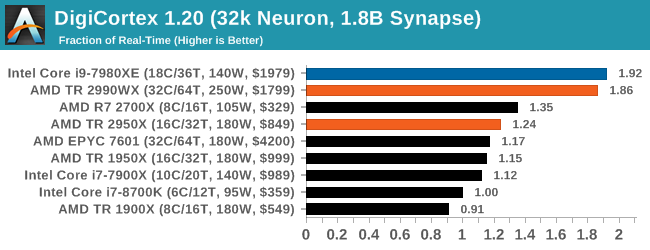
Here the quad-core processors with lots of cores have a good lead out front, however the low frequency of the EPYC 7601 puts it down the list. It would seem that the extra latency bi-modal cores in the 2990WX have not done too much damage, although you would feel that there might be extra performance to gain.
y-Cruncher v0.7.6: Microarchitecture Optimized Compute
I’ve known about y-Cruncher for a while, as a tool to help compute various mathematical constants, but it wasn’t until I began talking with its developer, Alex Yee, a researcher from NWU and now software optimization developer, that I realized that he has optimized the software like crazy to get the best performance. Naturally, any simulation that can take 20+ days can benefit from a 1% performance increase! Alex started y-cruncher as a high-school project, but it is now at a state where Alex is keeping it up to date to take advantage of the latest instruction sets before they are even made available in hardware.
For our test we run y-cruncher v0.7.6 through all the different optimized variants of the binary, single threaded and multi-threaded, including the AVX-512 optimized binaries. The test is to calculate 250m digits of Pi, and we use the single threaded and multi-threaded versions of this test.
Users can download y-cruncher from Alex’s website: http://www.numberworld.org/y-cruncher/
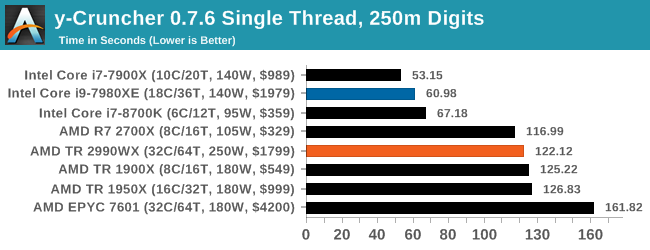
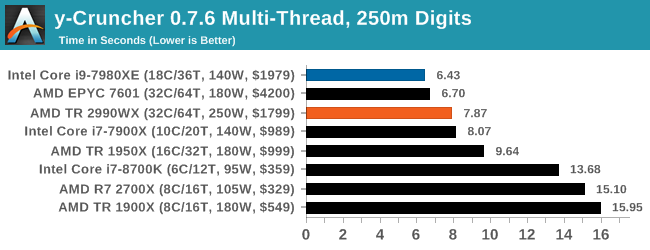
The Intel software is heavily optimized for AVX2 or AVX512, which sows in our single threaded test, however when we pile on the cores and the memory channels, both of AMD’s 32-core parts give the Core i9 a run for its money.
Agisoft Photoscan 1.3.3: 2D Image to 3D Model Conversion
One of the ISVs that we have worked with for a number of years is Agisoft, who develop software called PhotoScan that transforms a number of 2D images into a 3D model. This is an important tool in model development and archiving, and relies on a number of single threaded and multi-threaded algorithms to go from one side of the computation to the other.
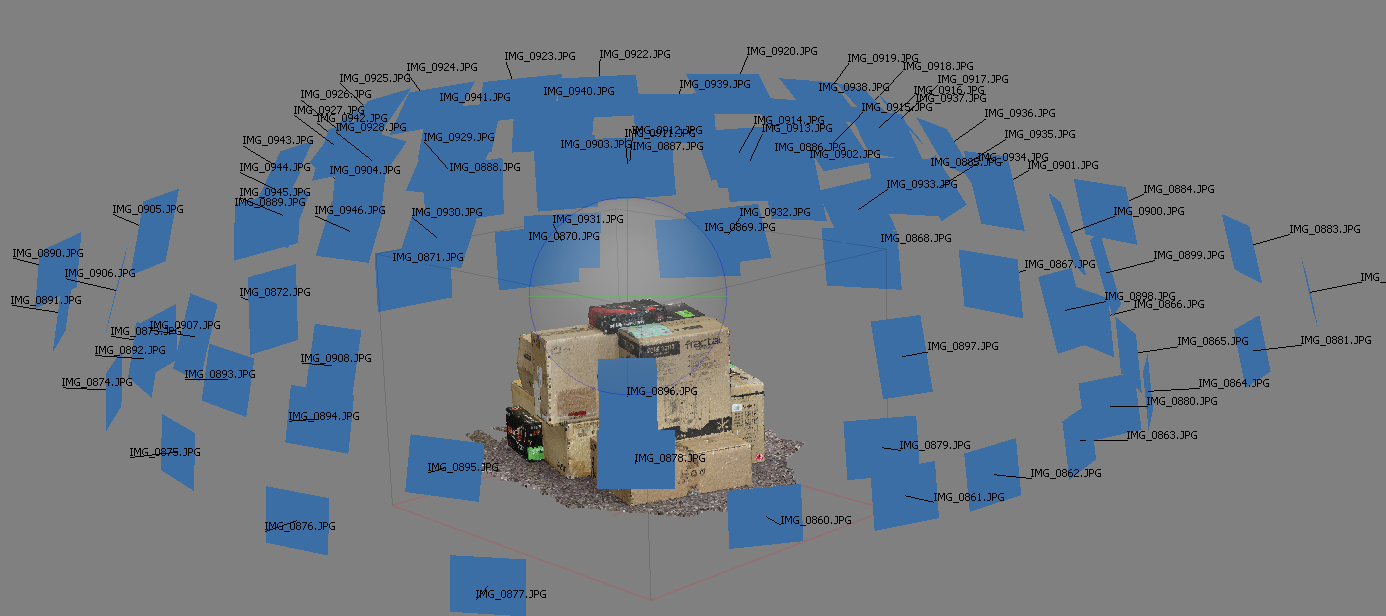
In our test, we take v1.3.3 of the software with a good sized data set of 84 x 18 megapixel photos and push it through a reasonably fast variant of the algorithms, but is still more stringent than our 2017 test. We report the total time to complete the process.
Agisoft’s Photoscan website can be found here: http://www.agisoft.com/
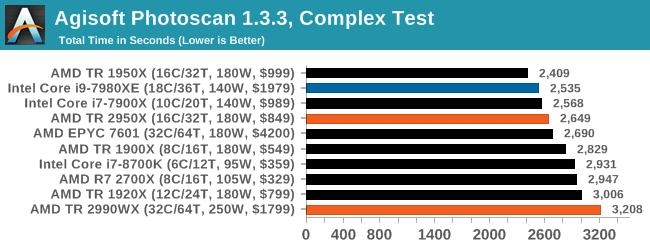
Photoscan shows a good spread, however the 2990WX is sitting at the back as it has cores that cannot access memory quick enough – the EPYC 7601 with double the memory channels operates almost 500 seconds (20%+) quicker, so if the 2990WX had extra memory, I’m sure it would shoot up the list.
Interesting the TR 1950X sits top, above the TR 2950X which has better cache latency and higher frequency in all scenarios. That’s a head scratcher.
HEDT Benchmarks: Rendering Tests
Rendering is often a key target for processor workloads, lending itself to a professional environment. It comes in different formats as well, from 3D rendering through rasterization, such as games, or by ray tracing, and invokes the ability of the software to manage meshes, textures, collisions, aliasing, physics (in animations), and discarding unnecessary work. Most renderers offer CPU code paths, while a few use GPUs and select environments use FPGAs or dedicated ASICs. For big studios however, CPUs are still the hardware of choice.
Corona 1.3: Performance Render
An advanced performance based renderer for software such as 3ds Max and Cinema 4D, the Corona benchmark renders a generated scene as a standard under its 1.3 software version. Normally the GUI implementation of the benchmark shows the scene being built, and allows the user to upload the result as a ‘time to complete’.
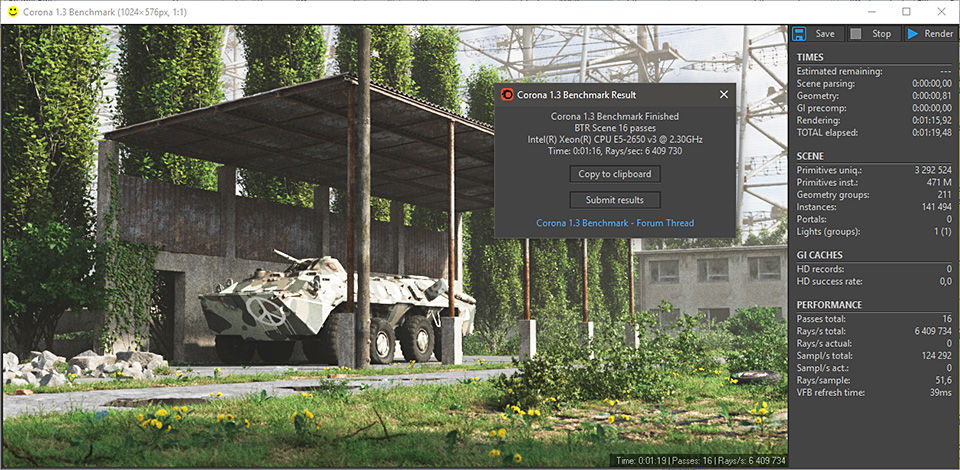
We got in contact with the developer who gave us a command line version of the benchmark that does a direct output of results. Rather than reporting time, we report the average number of rays per second across six runs, as the performance scaling of a result per unit time is typically visually easier to understand.
The Corona benchmark website can be found at https://corona-renderer.com/benchmark
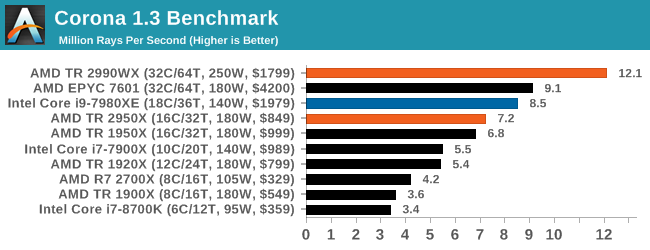
So this is where AMD broke our graphing engine. Because we report Corona in rays per second, having 12 million of them puts eight digits into our engine, which it then tries to interpret as a scientific number (1.2 x 10^7), which it can’t process in a graph. We had to convert this graph into millions of rays per second to get it to work.
The 2990WX hits out in front with 32 cores, with its higher frequency being the main reason it is so far ahead of the EPYC processor. The EPYC and Core i9 are close together, however the TR2950X at half the cost comes reasonably close.
Blender 2.79b: 3D Creation Suite
A high profile rendering tool, Blender is open-source allowing for massive amounts of configurability, and is used by a number of high-profile animation studios worldwide. The organization recently released a Blender benchmark package, a couple of weeks after we had narrowed our Blender test for our new suite, however their test can take over an hour. For our results, we run one of the sub-tests in that suite through the command line - a standard ‘bmw27’ scene in CPU only mode, and measure the time to complete the render.
Blender can be downloaded at https://www.blender.org/download/
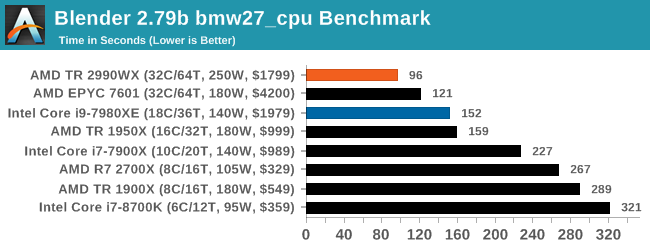
The additional cores on the 2990WX puts it out ahead of the EPYC and Core i9, with the 2990WX having an extra 58% throughput over the Core i9. That is very substantial indeed.
LuxMark v3.1: LuxRender via Different Code Paths
As stated at the top, there are many different ways to process rendering data: CPU, GPU, Accelerator, and others. On top of that, there are many frameworks and APIs in which to program, depending on how the software will be used. LuxMark, a benchmark developed using the LuxRender engine, offers several different scenes and APIs.
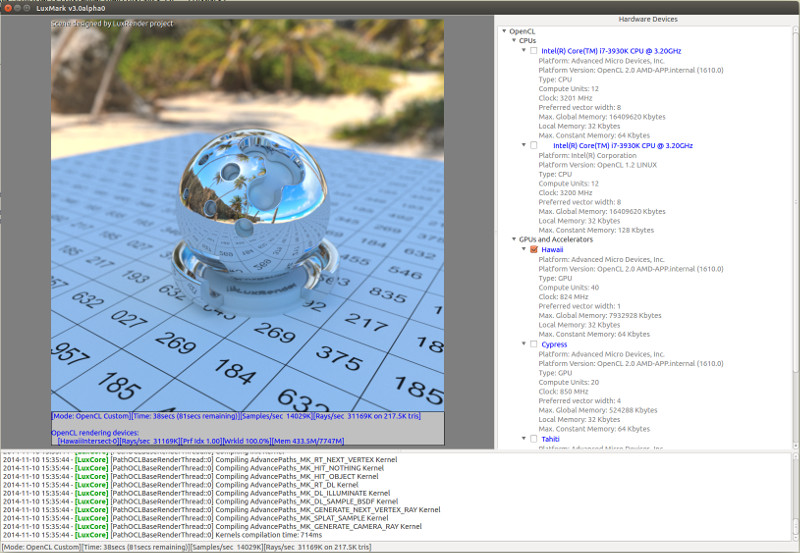
Taken from the Linux Version of LuxMark
In our test, we run the simple ‘Ball’ scene on both the C++ and OpenCL code paths, but in CPU mode. This scene starts with a rough render and slowly improves the quality over two minutes, giving a final result in what is essentially an average ‘kilorays per second’.
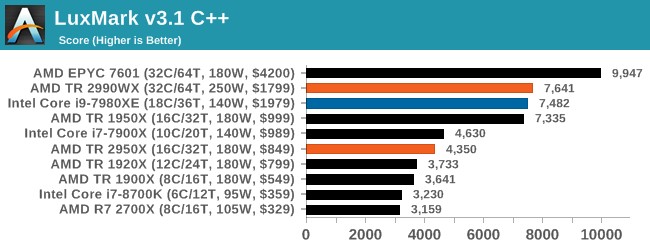
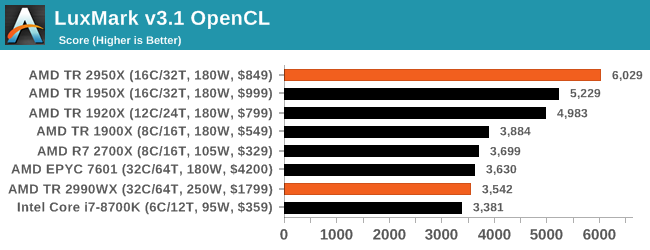
Intel’s Skylake-X processors seem to fail our OpenCL test for some reason, but in the C++ test the extra memory controllers on EPYC sets it ahead of both TR2 and Core i9. The 2990WX and Core i9 are almost equal here.
POV-Ray 3.7.1: Ray Tracing
The Persistence of Vision ray tracing engine is another well-known benchmarking tool, which was in a state of relative hibernation until AMD released its Zen processors, to which suddenly both Intel and AMD were submitting code to the main branch of the open source project. For our test, we use the built-in benchmark for all-cores, called from the command line.
POV-Ray can be downloaded from http://www.povray.org/
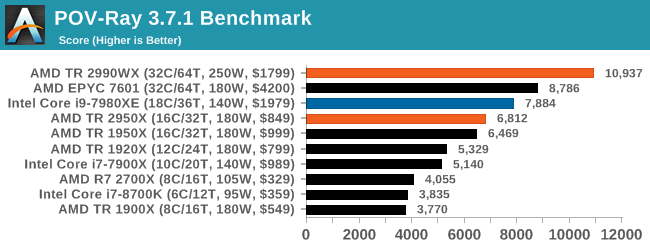
This test is another that loves the cores and frequency of the 2990WX, finishing the benchmark in almost 20 seconds. It might be time for a bigger built-in benchmark.
HEDT Benchmarks: Office Tests
The Office test suite is designed to focus around more industry standard tests that focus on office workflows, system meetings, some synthetics, but we also bundle compiler performance in with this section. For users that have to evaluate hardware in general, these are usually the benchmarks that most consider.
PCMark 10: Industry Standard System Profiler
Futuremark, now known as UL, has developed benchmarks that have become industry standards for around two decades. The latest complete system test suite is PCMark 10, upgrading over PCMark 8 with updated tests and more OpenCL invested into use cases such as video streaming.
PCMark splits its scores into about 14 different areas, including application startup, web, spreadsheets, photo editing, rendering, video conferencing, and physics. We post all of these numbers in our benchmark database, Bench, however the key metric for the review is the overall score.
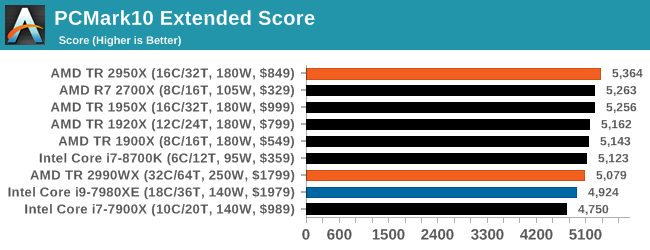
One of the downsides of PCMark is that it seems to bunch up all the results, showing them relatively close together, but interestingly here that the Intel processors sit near the bottom, with the 2950X and 2700X on the podium.
Chromium Compile: Windows VC++ Compile of Chrome 56
A large number of AnandTech readers are software engineers, looking at how the hardware they use performs. While compiling a Linux kernel is ‘standard’ for the reviewers who often compile, our test is a little more varied – we are using the windows instructions to compile Chrome, specifically a Chrome 56 build from March 2017, as that was when we built the test. Google quite handily gives instructions on how to compile with Windows, along with a 400k file download for the repo.
In our test, using Google’s instructions, we use the MSVC compiler and ninja developer tools to manage the compile. As you may expect, the benchmark is variably threaded, with a mix of DRAM requirements that benefit from faster caches. Data procured in our test is the time taken for the compile, which we convert into compiles per day.
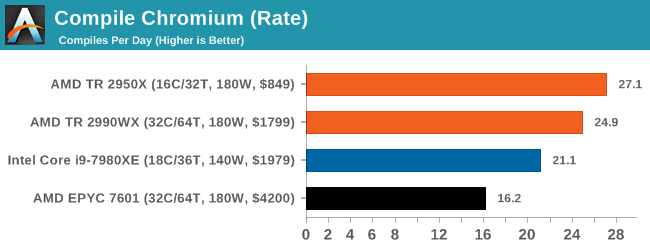
This test is such a nice mix of ST, MT, and memory limited flow that it is really interesting to see where the results end up. Unfortunately for our new suite the output files were not set up correctly, so despite running the test we only ever got a handful of results. But it shows an interesting metric: the 2950X sits ahead of the 2990WX, with both ahead of the Core i9, and the EPYC system being beaten handily due to its lower frequencies.
3DMark Physics: In-Game Physics Compute
Alongside PCMark is 3DMark, Futuremark’s (UL’s) gaming test suite. Each gaming tests consists of one or two GPU heavy scenes, along with a physics test that is indicative of when the test was written and the platform it is aimed at. The main overriding tests, in order of complexity, are Ice Storm, Cloud Gate, Sky Diver, Fire Strike, and Time Spy.
Some of the subtests offer variants, such as Ice Storm Unlimited, which is aimed at mobile platforms with an off-screen rendering, or Fire Strike Ultra which is aimed at high-end 4K systems with lots of the added features turned on. Time Spy also currently has an AVX-512 mode (which we may be using in the future).
For our tests, we report in Bench the results from every physics test, but for the sake of the review we keep it to the most demanding of each scene: Ice Storm Unlimited, Cloud Gate, Sky Diver, Fire Strike Ultra, and Time Spy.
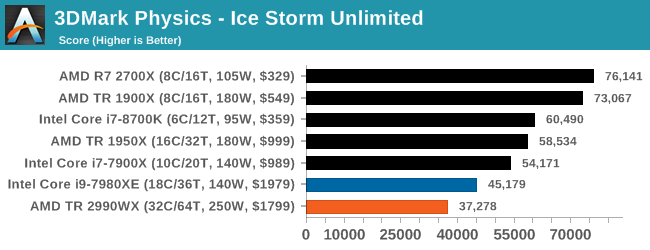
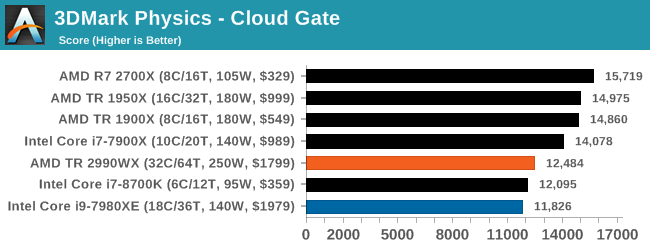
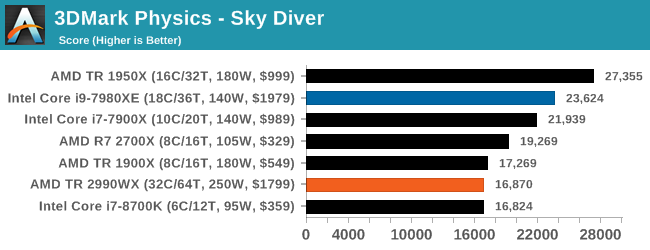
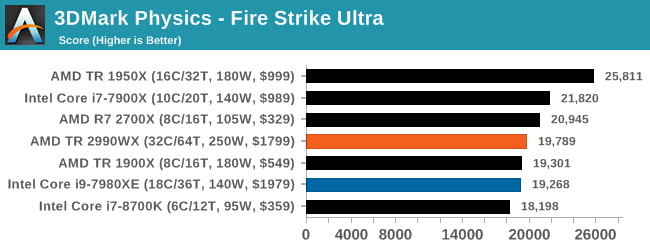
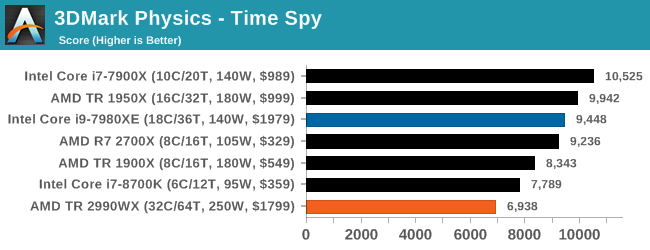
In the low end tests, it is clear that having these big processors doesn’t do much for performance, but even as we go up through Fire Strike and Time Spy, there seems to be a natural limit to the usefulness of these parts. Physics clearly loves having some extra memory bandwidth, and we know Time Spy isn’t meant to scale beyond about 10 cores, but we do see the 10 core processor sitting out front. Some of our testing sweeps had this benchmark configured incorrectly so it will be interesting to see how it fills out with some other mid and high core count processors.
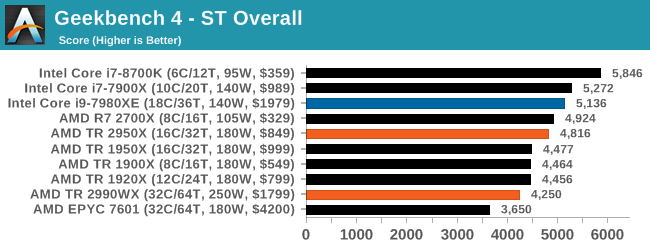
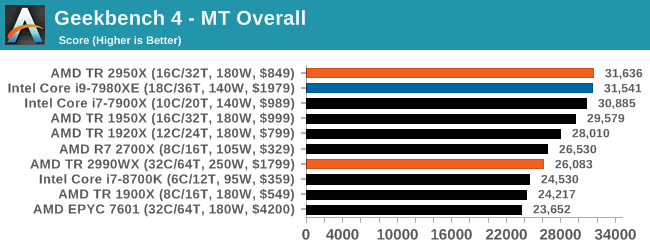
GeekBench4: Synthetics
A common tool for cross-platform testing between mobile, PC, and Mac, GeekBench 4 is an ultimate exercise in synthetic testing across a range of algorithms looking for peak throughput. Tests include encryption, compression, fast fourier transform, memory operations, n-body physics, matrix operations, histogram manipulation, and HTML parsing.
I’m including this test due to popular demand, although the results do come across as overly synthetic, and a lot of users often put a lot of weight behind the test due to the fact that it is compiled across different platforms (although with different compilers).
We record the main subtest scores (Crypto, Integer, Floating Point, Memory) in our benchmark database, but for the review we post the overall single and multi-threaded results.
HEDT Benchmarks: Encoding Tests
With the rise of streaming, vlogs, and video content as a whole, encoding and transcoding tests are becoming ever more important. Not only are more home users and gamers needing to convert video files into something more manageable, for streaming or archival purposes, but the servers that manage the output also manage around data and log files with compression and decompression. Our encoding tasks are focused around these important scenarios, with input from the community for the best implementation of real-world testing.
Handbrake 1.1.0: Streaming and Archival Video Transcoding
A popular open source tool, Handbrake is the anything-to-anything video conversion software that a number of people use as a reference point. The danger is always on version numbers and optimization, for example the latest versions of the software can take advantage of AVX-512 and OpenCL to accelerate certain types of transcoding and algorithms. The version we use here is a pure CPU play, with common transcoding variations.
We have split Handbrake up into several tests, using a Logitech C920 1080p60 native webcam recording (essentially a streamer recording), and convert them into two types of streaming formats and one for archival. The output settings used are:
- 720p60 at 6000 kbps constant bit rate, fast setting, high profile
- 1080p60 at 3500 kbps constant bit rate, faster setting, main profile
- 1080p60 HEVC at 3500 kbps variable bit rate, fast setting, main profile
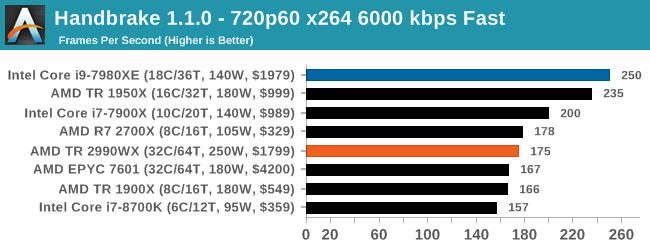
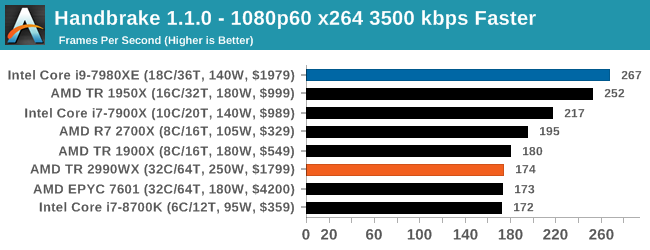
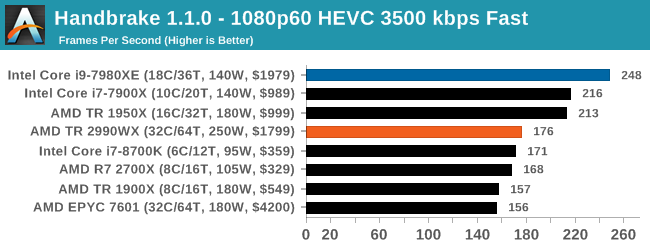
Video encoding is always an interesting mix of multi-threading, memory latency, and compute. The Core i9, with AVX2 instructions, sets a commanding lead in all three tests. The AMD processors seem to fluctuate a bit, with the 1950X and 2700X being the best of the bunch. Unfortunately we didn’t get 2950X results in our initial runs, but I would expect it to be competitive with the Core i9 for sure, given where the 1950X is. However the 2990WX does fall behind a bit.
7-zip v1805: Popular Open-Source Encoding Engine
Out of our compression/decompression tool tests, 7-zip is the most requested and comes with a built-in benchmark. For our test suite, we’ve pulled the latest version of the software and we run the benchmark from the command line, reporting the compression, decompression, and a combined score.
It is noted in this benchmark that the latest multi-die processors have very bi-modal performance between compression and decompression, performing well in one and badly in the other. There are also discussions around how the Windows Scheduler is implementing every thread. As we get more results, it will be interesting to see how this plays out.
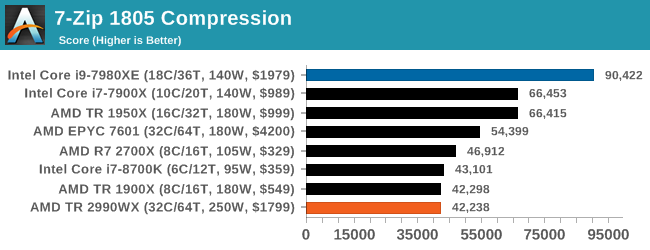
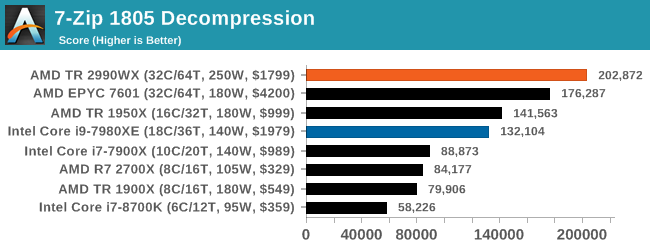
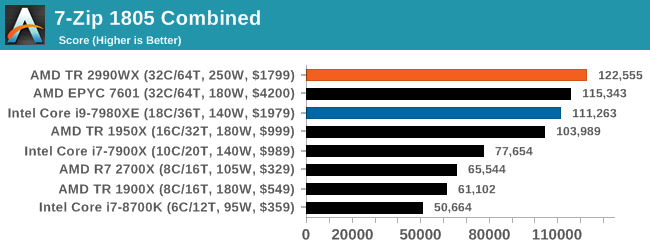
Oh boy, this was an interesting set of tests. When we initially published this review, without commentary, the compression graph with the 2990WX at the bottom was shared around social media like crazy, trying to paint a picture of why AMD performance isn’t great. It was also used in conjuction with Phoronix’s tests, that showed a much better picture on Linux.
But what confuses me is that almost no-one also posted the decompression graph. Here AMD’s 32-core processors take a commanding lead, with the 16/18-core parts being the best of the rest.
If you plan to share out the Compression graph, please include the Decompression one. Otherwise you’re only presenting half a picture.
WinRAR 5.60b3: Archiving Tool
My compression tool of choice is often WinRAR, having been one of the first tools a number of my generation used over two decades ago. The interface has not changed much, although the integration with Windows right click commands is always a plus. It has no in-built test, so we run a compression over a set directory containing over thirty 60-second video files and 2000 small web-based files at a normal compression rate.
WinRAR is variable threaded but also susceptible to caching, so in our test we run it 10 times and take the average of the last five, leaving the test purely for raw CPU compute performance.
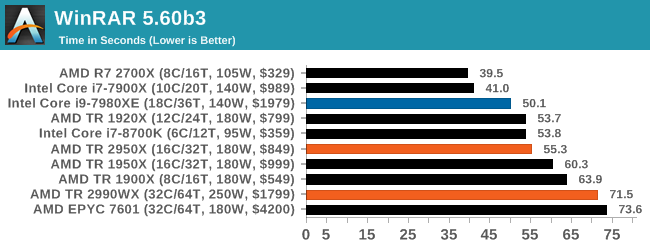
A set of high frequency cores and good memory is usually beneficial, but sometimes some more memory bandwidth and lower latency helps. At the top is AMD’s R7 2700X, with the Intel 10-core just behind. I’m surprised not to see the 8700K in there, perhaps its six cores is not enough. But the higher core count AMD parts struggle to gain traction here, with the 32-core parts taking some sweet time to finish this test.
AES Encryption: File Security
A number of platforms, particularly mobile devices, are now offering encryption by default with file systems in order to protect the contents. Windows based devices have these options as well, often applied by BitLocker or third-party software. In our AES encryption test, we used the discontinued TrueCrypt for its built-in benchmark, which tests several encryption algorithms directly in memory.
The data we take for this test is the combined AES encrypt/decrypt performance, measured in gigabytes per second. The software does use AES commands for processors that offer hardware selection, however not AVX-512.
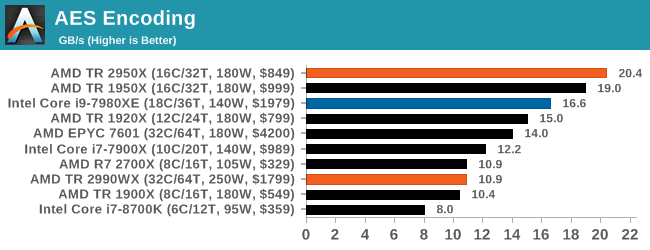
Normally we see this test go very well when there are plenty of cores, but it would seem that the bi-modal nature of the cores and memory controllers in the 2990WX gives a poor result. The EPYC 7601, with eight memory controllers, does a better job, however the 1950X wins here. The 2950X, where all cores have a similar access profile, scores top here, well above Intel’s 18-core Core i9.
HEDT Benchmarks: Web and Legacy Tests
While more the focus of low-end and small form factor systems, web-based benchmarks are notoriously difficult to standardize. Modern web browsers are frequently updated, with no recourse to disable those updates, and as such there is difficulty in keeping a common platform. The fast paced nature of browser development means that version numbers (and performance) can change from week to week. Despite this, web tests are often a good measure of user experience: a lot of what most office work is today revolves around web applications, particularly email and office apps, but also interfaces and development environments. Our web tests include some of the industry standard tests, as well as a few popular but older tests.
We have also included our legacy benchmarks in this section, representing a stack of older code for popular benchmarks.
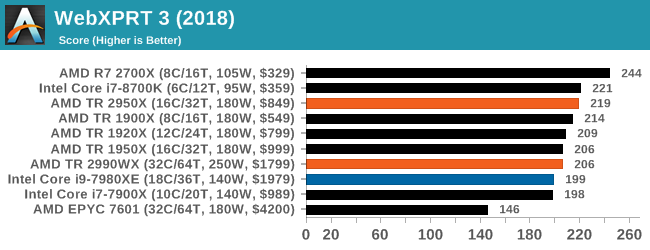
WebXPRT 3: Modern Real-World Web Tasks, including AI
The company behind the XPRT test suites, Principled Technologies, has recently released the latest web-test, and rather than attach a year to the name have just called it ‘3’. This latest test (as we started the suite) has built upon and developed the ethos of previous tests: user interaction, office compute, graph generation, list sorting, HTML5, image manipulation, and even goes as far as some AI testing.
For our benchmark, we run the standard test which goes through the benchmark list seven times and provides a final result. We run this standard test four times, and take an average.
Users can access the WebXPRT test at http://principledtechnologies.com/benchmarkxprt/webxprt/
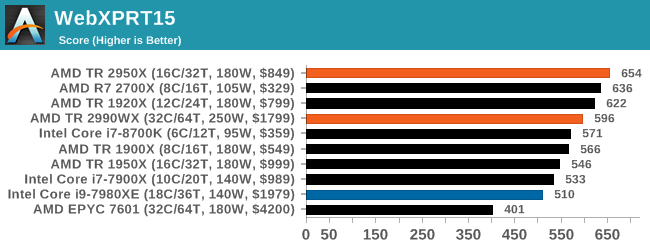
WebXPRT 2015: HTML5 and Javascript Web UX Testing
The older version of WebXPRT is the 2015 edition, which focuses on a slightly different set of web technologies and frameworks that are in use today. This is still a relevant test, especially for users interacting with not-the-latest web applications in the market, of which there are a lot. Web framework development is often very quick but with high turnover, meaning that frameworks are quickly developed, built-upon, used, and then developers move on to the next, and adjusting an application to a new framework is a difficult arduious task, especially with rapid development cycles. This leaves a lot of applications as ‘fixed-in-time’, and relevant to user experience for many years.
Similar to WebXPRT3, the main benchmark is a sectional run repeated seven times, with a final score. We repeat the whole thing four times, and average those final scores.
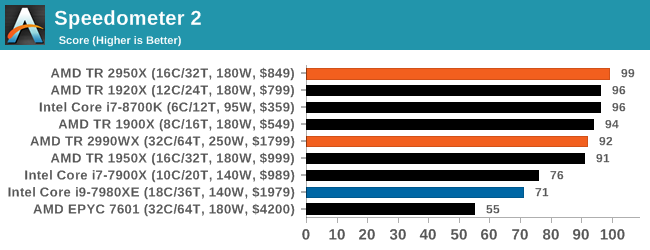
Speedometer 2: Javascript Frameworks
Our newest web test is Speedometer 2, which is a accrued test over a series of javascript frameworks to do three simple things: built a list, enable each item in the list, and remove the list. All the frameworks implement the same visual cues, but obviously apply them from different coding angles.
Our test goes through the list of frameworks, and produces a final score indicative of ‘rpm’, one of the benchmarks internal metrics. We report this final score.
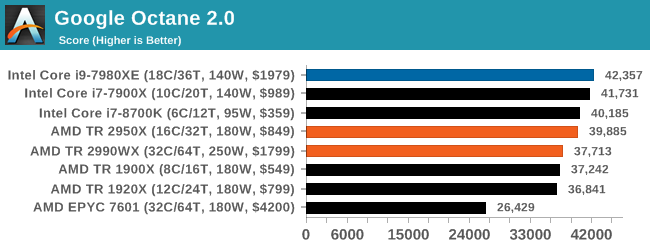
Google Octane 2.0: Core Web Compute
A popular web test for several years, but now no longer being updated, is Octane, developed by Google. Version 2.0 of the test performs the best part of two-dozen compute related tasks, such as regular expressions, cryptography, ray tracing, emulation, and Navier-Stokes physics calculations.
The test gives each sub-test a score and produces a geometric mean of the set as a final result. We run the full benchmark four times, and average the final results.
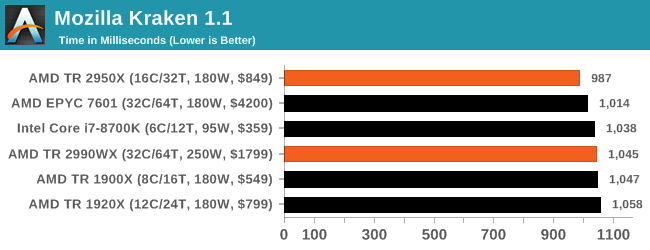
Mozilla Kraken 1.1: Core Web Compute
Even older than Octane is Kraken, this time developed by Mozilla. This is an older test that does similar computational mechanics, such as audio processing or image filtering. Kraken seems to produce a highly variable result depending on the browser version, as it is a test that is keenly optimized for.
The main benchmark runs through each of the sub-tests ten times and produces an average time to completion for each loop, given in milliseconds. We run the full benchmark four times and take an average of the time taken.
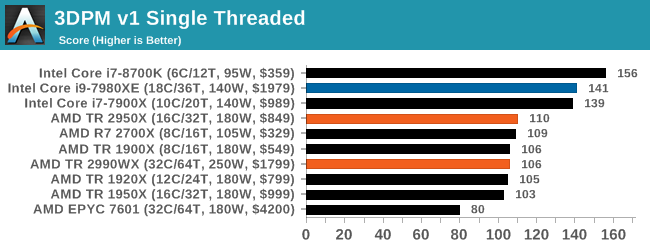
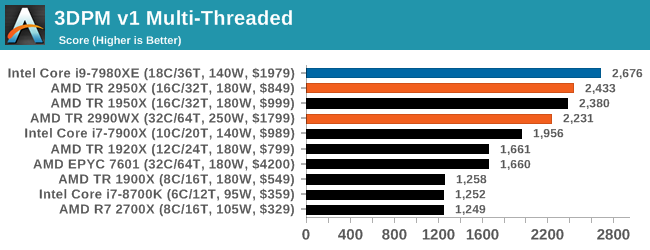
3DPM v1: Naïve Code Variant of 3DPM v2.1
The first legacy test in the suite is the first version of our 3DPM benchmark. This is the ultimate naïve version of the code, as if it was written by scientist with no knowledge of how computer hardware, compilers, or optimization works (which in fact, it was at the start). This represents a large body of scientific simulation out in the wild, where getting the answer is more important than it being fast (getting a result in 4 days is acceptable if it’s correct, rather than sending someone away for a year to learn to code and getting the result in 5 minutes).
In this version, the only real optimization was in the compiler flags (-O2, -fp:fast), compiling it in release mode, and enabling OpenMP in the main compute loops. The loops were not configured for function size, and one of the key slowdowns is false sharing in the cache. It also has long dependency chains based on the random number generation, which leads to relatively poor performance on specific compute microarchitectures.
3DPM v1 can be downloaded with our 3DPM v2 code here: 3DPMv2.1.rar (13.0 MB)
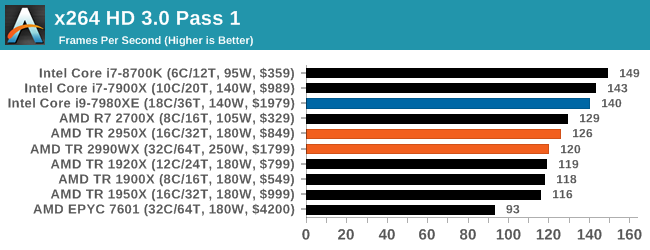
x264 HD 3.0: Older Transcode Test
This transcoding test is super old, and was used by Anand back in the day of Pentium 4 and Athlon II processors. Here a standardized 720p video is transcoded with a two-pass conversion, with the benchmark showing the frames-per-second of each pass. This benchmark is single-threaded, and between some micro-architectures we seem to actually hit an instructions-per-clock wall.
Power Consumption, TDP, and Prime95 vs POV-Ray
For most of us, processors hover around the 15W range in notebooks, and 65-95W in desktops. High-end desktop processors have always been power hungry, with numbers of 130W and 140W fairly common. When AMD launched a 220W processor on the old Vishera platform, pushing the Bulldozer family cores up to 5.0 GHz, we all thought AMD was completely mental – there were plenty of motherboards that were socket compatible at the time, although to actually harness 220W and up, a range of new high-end motherboards had to be announced. Intel’s highest on-roadmap processor part to date has an official TDP rating of 205W, but now AMD has gone one better, with 250W.
The two new WX processors, the 32-core 2990WX and 2970WX, are both rated for 250W. In both cases they have all four silicon dies active, six Infinity Fabric links active (as described in page 4), and aim to push the boundaries in performance, with AMD showing slides with a 3.6 GHz all-core turbo. The other two processors, X-series replacements, are at 180W, the same as the first generation Threadripper parts they replace.
However, not all TDPs are equal. How Intel and AMD measure TDP has changed over the years, and subsequently now have little value to the real world. Let me explain.
TDP Is a Joke
The value of TDP, or thermal design power, is not a measure of power consumption. It is technically a measure of cooler performance, and a cooler needs to be rated at the TDP level in order to perform regular functions. Actual power consumption should technically be higher – thermal losses from the processor into the socket and from the socket into the motherboard also contribute to cooling, but are not involved in the TDP number. However, for most use cases, TDP and power consumption are used interchangeably, as their differences are minor.
Given this is a review about AMD processors, we can start there. AMD’s TDP calculation relies on a simple formula:
TDP = (Load Temperature in Celsius – Idle Temperature in Celcius) / Thermal Capacity of Cooler
Thus typically AMD will quote for its Ryzen 7 2700X processor that with a load temperature of about 62C, an idle temperature of 42C, and a cooler with a thermal capacity of 0.189 C per Watt (the Wraith Max), we get a value of around 105W.
AMD’s formula has two problems in that the load temperature can be adjusted with fans / external air flow, and that the thermal capacity of the cooler can have a big impact in the result – with a large liquid cooler that has a higher thermal capacity, such as 0.400 C per Watt, then the rated TDP is actually lower: in the case of the Ryzen 7 2700X as above, it would come out as 50 W. AMD does use the thermal performance of its bundled cooler, just to keep things consistent, but it does mean that the TDP rating and the power consumption are not equal and can be manufacturered in a certain direction if AMD were simply to use a different cooler for its comparisons.
Intel’s version of TDP is a little more complex, for one main reason that has not made it into the ecosystem. Intel only defines its TDP for the base frequency, and not the turbo frequency. As a result, if Intel releases a processor with a 95W TDP, a base frequency of 3.2 GHz, a single-core turbo of 4.7 GHz, and an all-core turbo of 4.2 GHz, then Intel only guarantees that power consumption at the base frequency of 3.2 GHz will be 95W, not the all-core turbo. This leaves the base operation for the processor in any motherboard that uses turbo (all of them) to have a higher power draw than TDP in any loaded scenarios.
This is very annoying. Intel advertises the single core turbo quite prolifically in its marketing, and has recently decided that its all-core turbo values should not be published. We are told that it is proprietary, which is vast about-turn from its previous disclosure policy. Not only that, this data is freely available with the chips in hand. But it does mean that almost every processor will have an all-core turbo frequency above the base frequency, and thus can run above TDP very easily.
We can see this best with a Core i7-8700 and its 65W TDP. It has a 3.2 GHz base frequency, a single core turbo of 4.6 GHz, and an all-core turbo of 4.3 GHz. If we load up the threads and then limit the power consumption to 65W, we get the following:

So just a warning about when it comes to TDP values. Take them with a grain of salt. Or a spoonful.
Power Consumption
There are several ways to measure power consumption of a processor. The typical easy way is to use a power meter which gives the wall power consumption of the full system, including efficiency losses by the power delivery of the motherboard. The complex way is hooking up the required tools to the board to measure the current through the 12V connector, and measure the CPU voltage using the overclocking measurement points on certain motherboards. A third way is by reading the hardware registers with applicable software.
Reading registers is a double edged sword. First, you are relying on internal measurements, which often have one of the wider error margins. Second, you are relying on the CPU manufacturer to report the correct numbers, which is not always true (!). However on the plus side, we can often get more information out from the processor, such as a breakdown of per-core power, DRAM power, IO/Interconnect power, integrated graphics power, and a general look at how the power is distributed. The hardware registers are how the system tells itself how much power it is using, and how it has to adjust the voltage/frequency depending on current draw, power draw, or thermal performance. The other plus side is that we can roll it into our testing scripts fairly easily.
Testing for power consumption is also a topic to consider. Usually a power virus is used, which can prod every area of the processor simultaneously for the peak power draw. A power virus is often used as an overclocking stability test, but these have one drawback in that they typically do not represent real-world power draw. It is a fine line between a real-world test and a synthetic test designed to cram every joule of energy through a chip. Software such as LINPACK is often used as a highly optimized power test, or internal tools from Intel and AMD can stress a chip even harder.
Prime95 is an often used candidate, because it also ends up being hyper-optimized for almost every core and drives the power home. Its workload is semi-synthetic, based on calculating prime numbers, but the stress test forgoes the results and just aims at power. During this review, we started playing a little with POV-Ray as our power tester, as it seemed to cause more power draw than Prime95, while also being a real-world ray-tracing workload. As I am writing this, I am deciding which tool is best to measure power consumption: Prime95 has trouble with larger core counts (sometimes it is hard to get numbers beyond 25 threads), and to get POV-Ray to work technically we adjust the affinity loading, which is more about loading cores than threads, however the data suggests that it is actually the threads that are being loaded. I will point out which software we are using in our data at each stage, however our POV-Ray was developed mid-review, so most data is with Prime95.
Overall Power Consumption
For this first set of data, I want to represent the full-chip power consumption measured in different scenarios. Firstly at idle, which as we’ve seen on Page 4 can be properly dominated by how the interconnect on the processor powers up and powers down.
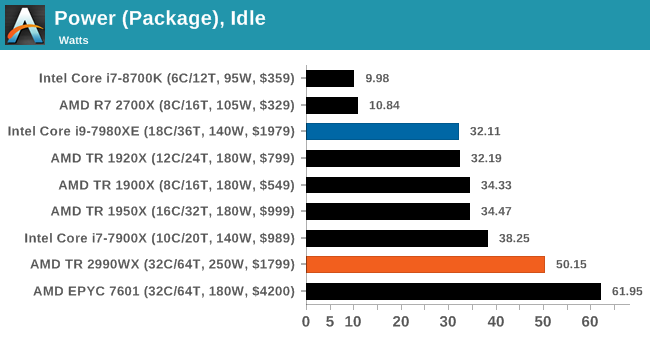
Next, we load a single core with two threads of Prime95. Our testing methodology forces both threads onto the same core for those that can accept multiple threads. Users focusing on a single task will be more in this area for power, or for systems where Windows is tinkering in the background.
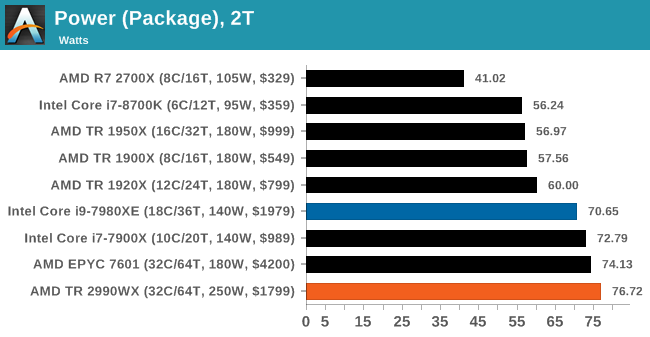
The third test is the system loaded with four threads of Prime95. This will cover the majority of how most people use systems day to day, with multiple browser tabs and windows open, several software packages on the go, or perhaps a game or two.
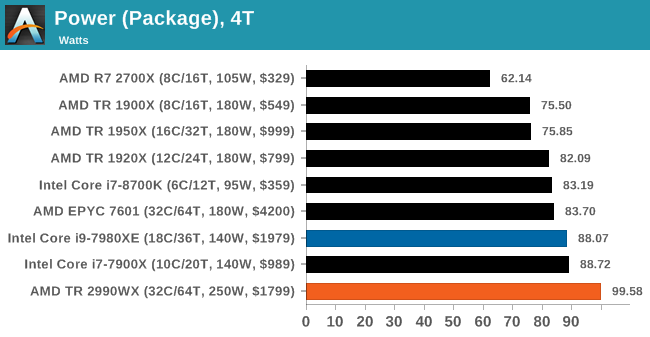
Moving up a gear to twelve threads of Prime95, we are moving more into the multi-taskers that have sizeable workloads. This will include gamers and streamers, or users who are rendering while also performing other tasks.
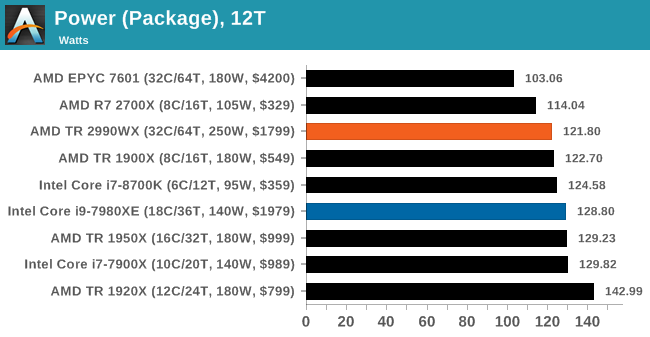
The final graph, for good measure, is the full load power draw. For this test we are running a full set of Prime95 threads, however in the future we will be using POV-Ray for this test as it tends to be more consistent, especially at high thread-count workloads. The only downside here is that an overclocked 2990WX can complete the POV-Ray test in under 20 seconds.
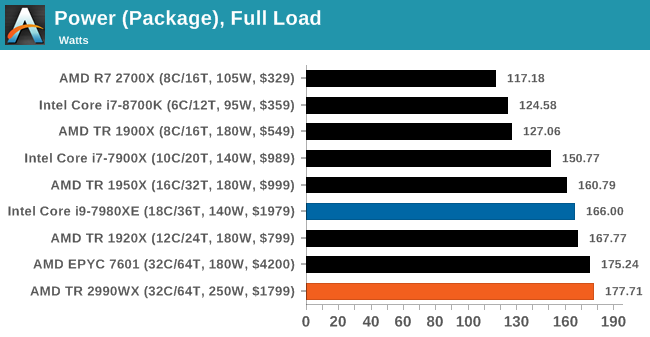
Per-Core Power Consumption
Before we created the POV-Ray power consumption test, I ran both of the new Threadripper processors we have on an all-threads test with Prime95, and extracted the power consumption of each core at each loading. Click each image to zoom in.

On the first core loading, we can see that the power consumption is ~23W, which is super high for a single Zeppelin core. This goes through to two cores loaded as well, but when we hit three cores we only top out around 18.8W per core. Given that this chip has four CCXes, we have to wonder if this is because the threads are being loaded onto the same CCX (which is what is happening, based on the processor enumeration), and we are hitting CCX power limits. At four cores loaded, each core is more around 17.4W.
Moving onto five cores loaded, and the fifth core sits at 18.2W while the other four are at 16.8W, indicating that this new core is located on a new CCX. When we move from eight cores to nine cores, we see the same thing whereby the ninth core has 17.5W of power, whereas the other eight are at 14.3W. The power distribution finally drops to 7-9W per core when we hit all 16 cores loaded.
At the end, we observe a total package power consumption of ~178W, near the 180W TDP, with ~135W on the cores and the rest on the non-core hardware (Infinity Fabric, IO, IMC).
Moving onto the 2990WX, and the story looks very odd indeed.
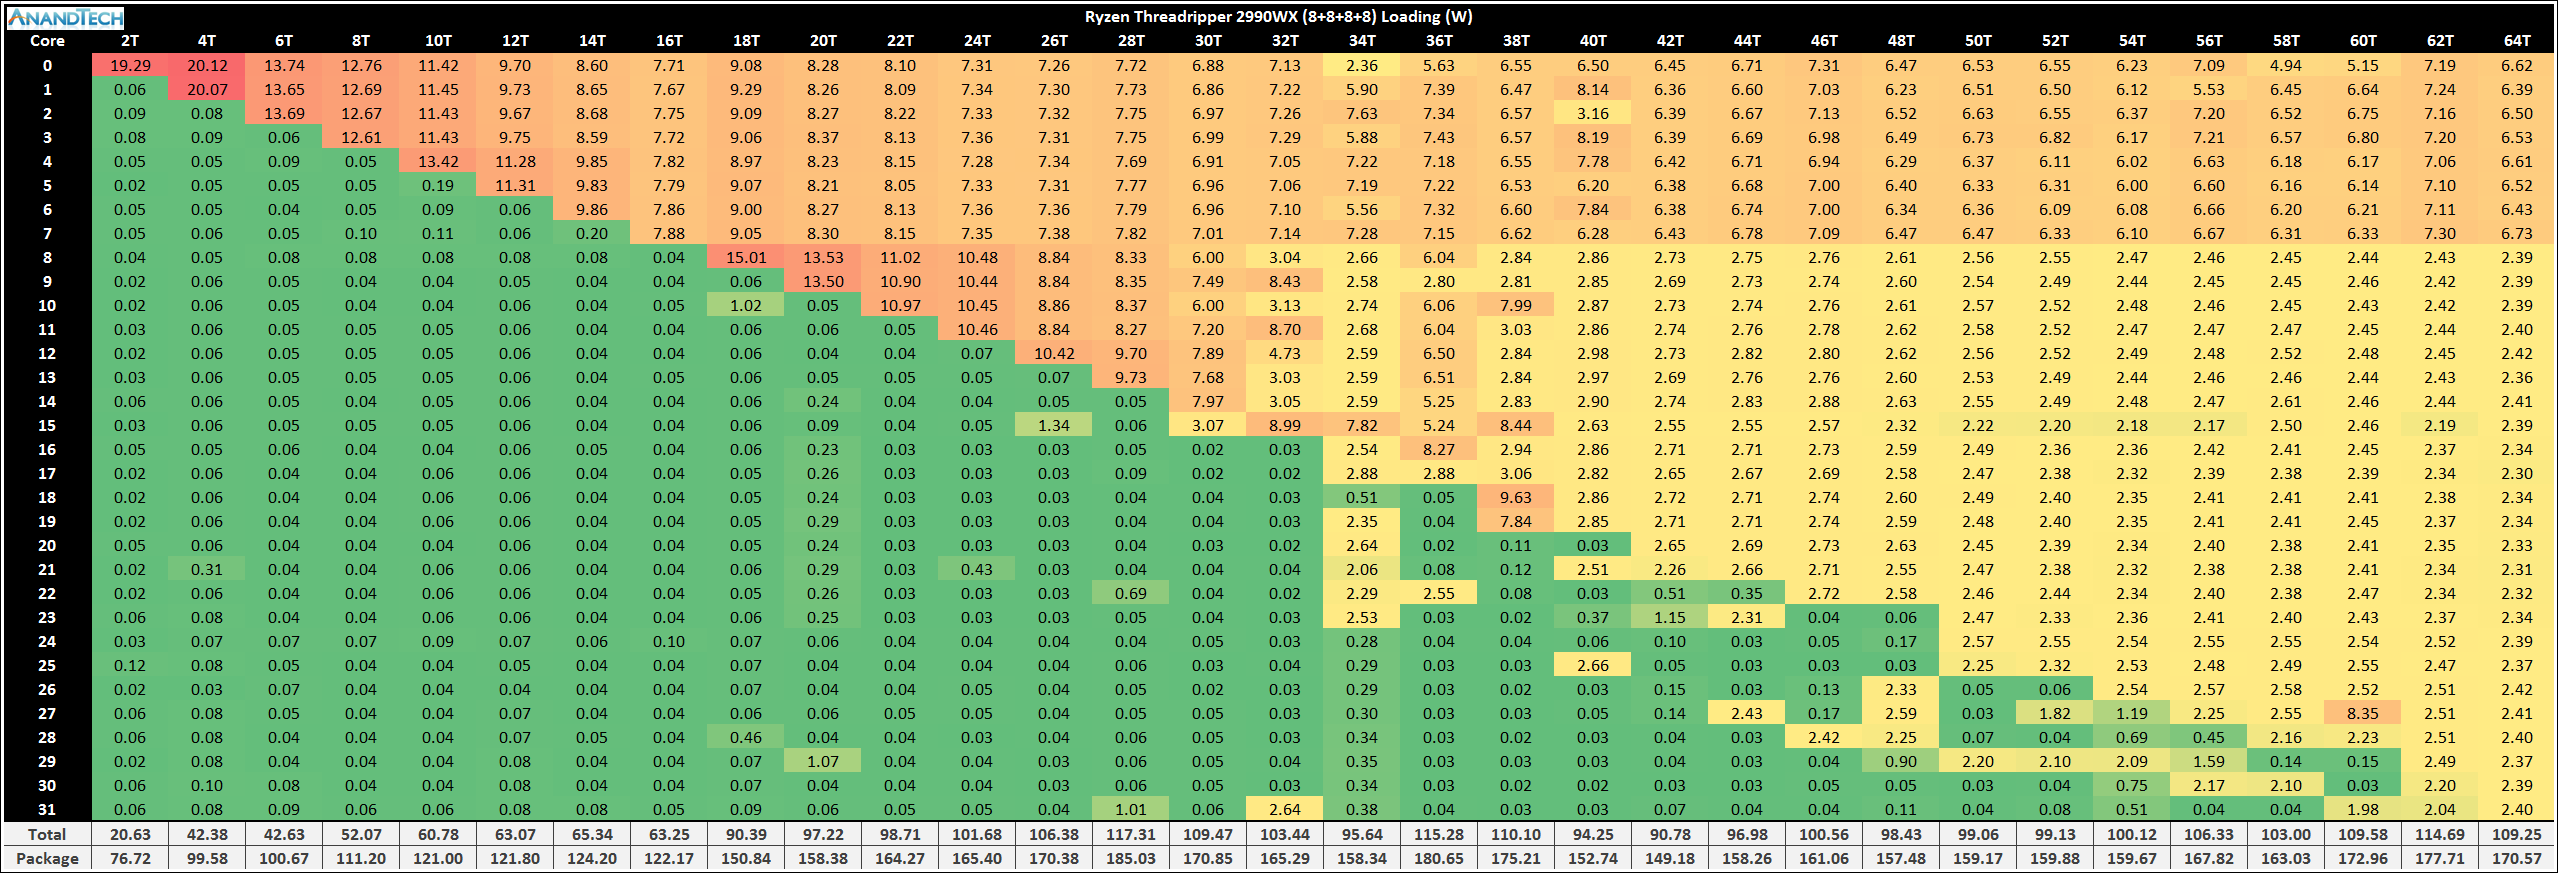
For the most part, the power consumption data up to 15 cores follows the same trend as the 2950X. However as we push on, it is clear that the first zeppelin die is clearly the favored – as more threads are loaded, power is taken from the second die, all the way down to 2.4W per core. The first zeppelin die, at full load, has around 6.6W per core, but all the other cores on the processor have 2.4W. There might be something in this test causing the first die to have preferential power over the others. It is also worth noting that the power consumption for the chip is near 180W, not the 250W as listed by TDP.
It was around this time that the POV-Ray version of the power script was developed. I ran it through the 2990WX to see the results. This time it was far more as expected:
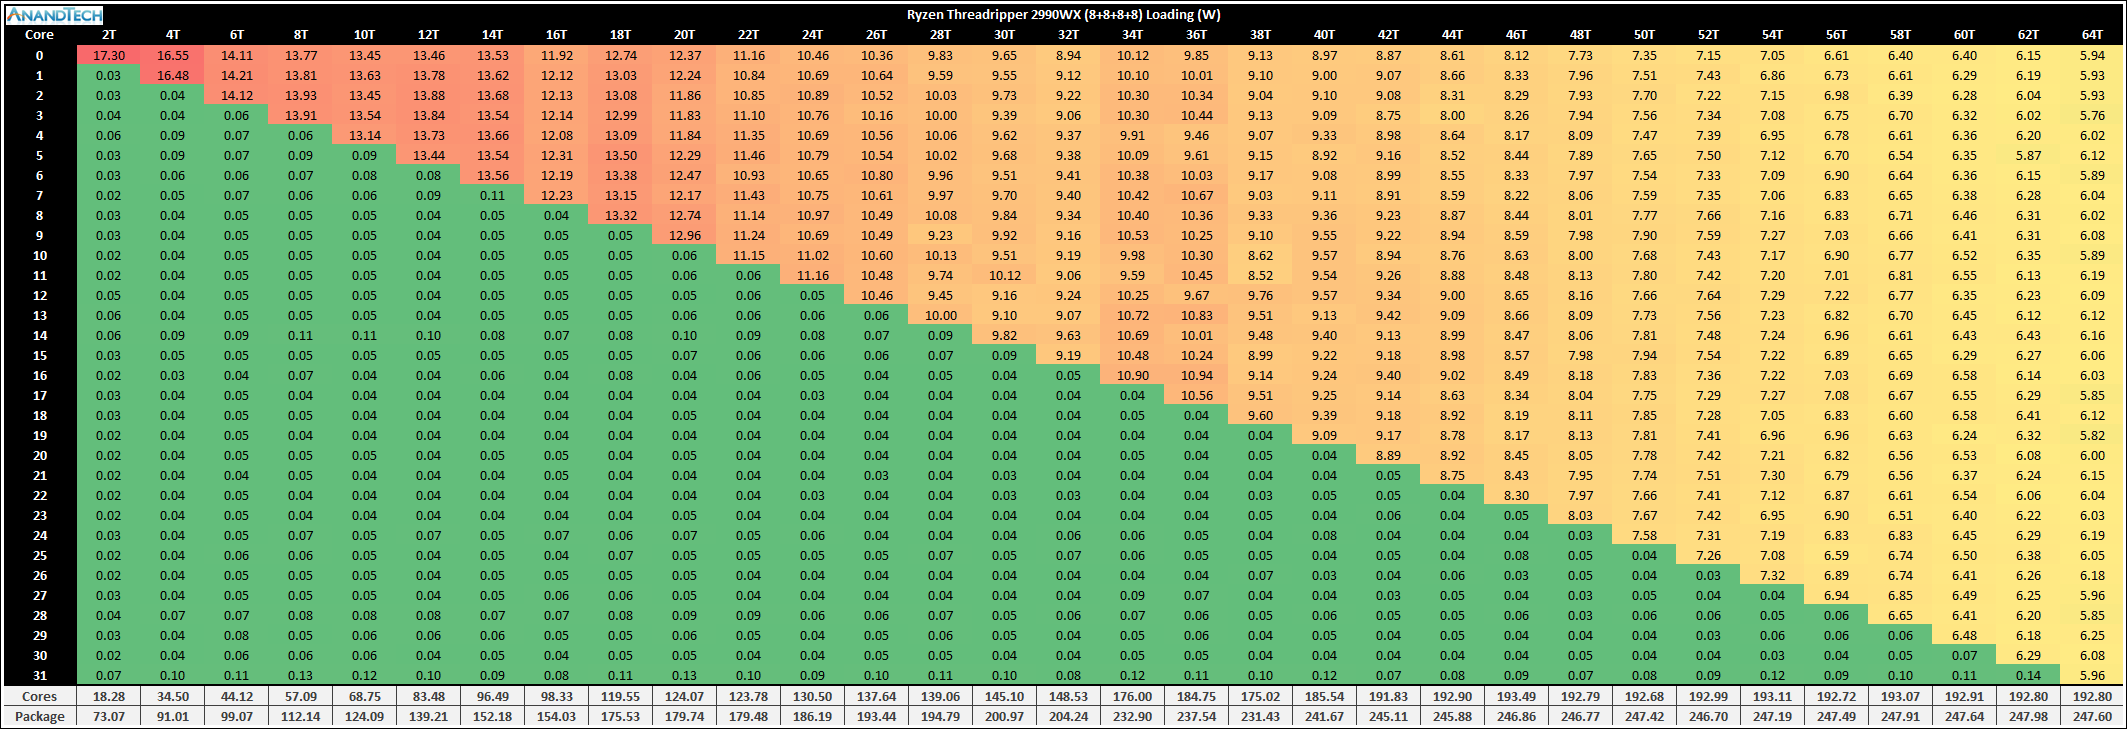
Surprisingly, the load became very evenly distributed as the number of threads was ramped, as we were able to fully use up to the 250W TDP even at stock levels with a good cooler. In the end we were using 193W for the cores and 55W for everything else, and at no point did we see active cores dangling below 3W – in fact when all the cores were loaded, each core seemed to find 6W to be comfortable. We hit the 240W-250W package power at around 40 threads loaded, and beyond that each core added meant the power had to be redistributed.
Two thoughts came to mind – the first was easily verifiable: the BIOS was stuck at 180W power consumption after putting in the 2950X perhaps? I checked and before I did the 2990WX power tests, I previously had had the 1920X in. I did a full BIOS reset, and did not see a change, indicating that this wasn’t a BIOS power limitation.
The second is to look at frequencies. Taking a single data point, 40 threads loaded, there was a slight differential, but only in power.
During the Prime95 test, the first silicon die was running at around 7W per core, and had a frequency of 3575 MHz. The second silicon die was shown at 3W per core, but at 3525 MHz. The other idle cores were at 1775 MHz or 2000 MHz, consuming milliwatts.
During the POV-Ray test, every active core was at around 9.1W per core, and had a frequency of 3575 MHz. All the idle cores were at 2000 MHz (three of which at 1775 MHz), again consuming milliwatts per core.
Aside from the per-core power numbers being reported, the chips seemed overall similar in frequencies, with the POV-Ray test a little higher, which comes through in the total power consumption under POV-Ray being higher.
Ultimately it comes down to this – power reporting with Prime95 beyond 20 cores or so, or on multi-die chips, doesn’t seem to work that well. Going forward we will be using our POV-Ray test, which also seems to draw more power.
Core vs Non-Core Power
Going back to the page where we spoke about Infinity Fabric frequency, we can do a similar plot under the POV-Ray test for the 2990WX.
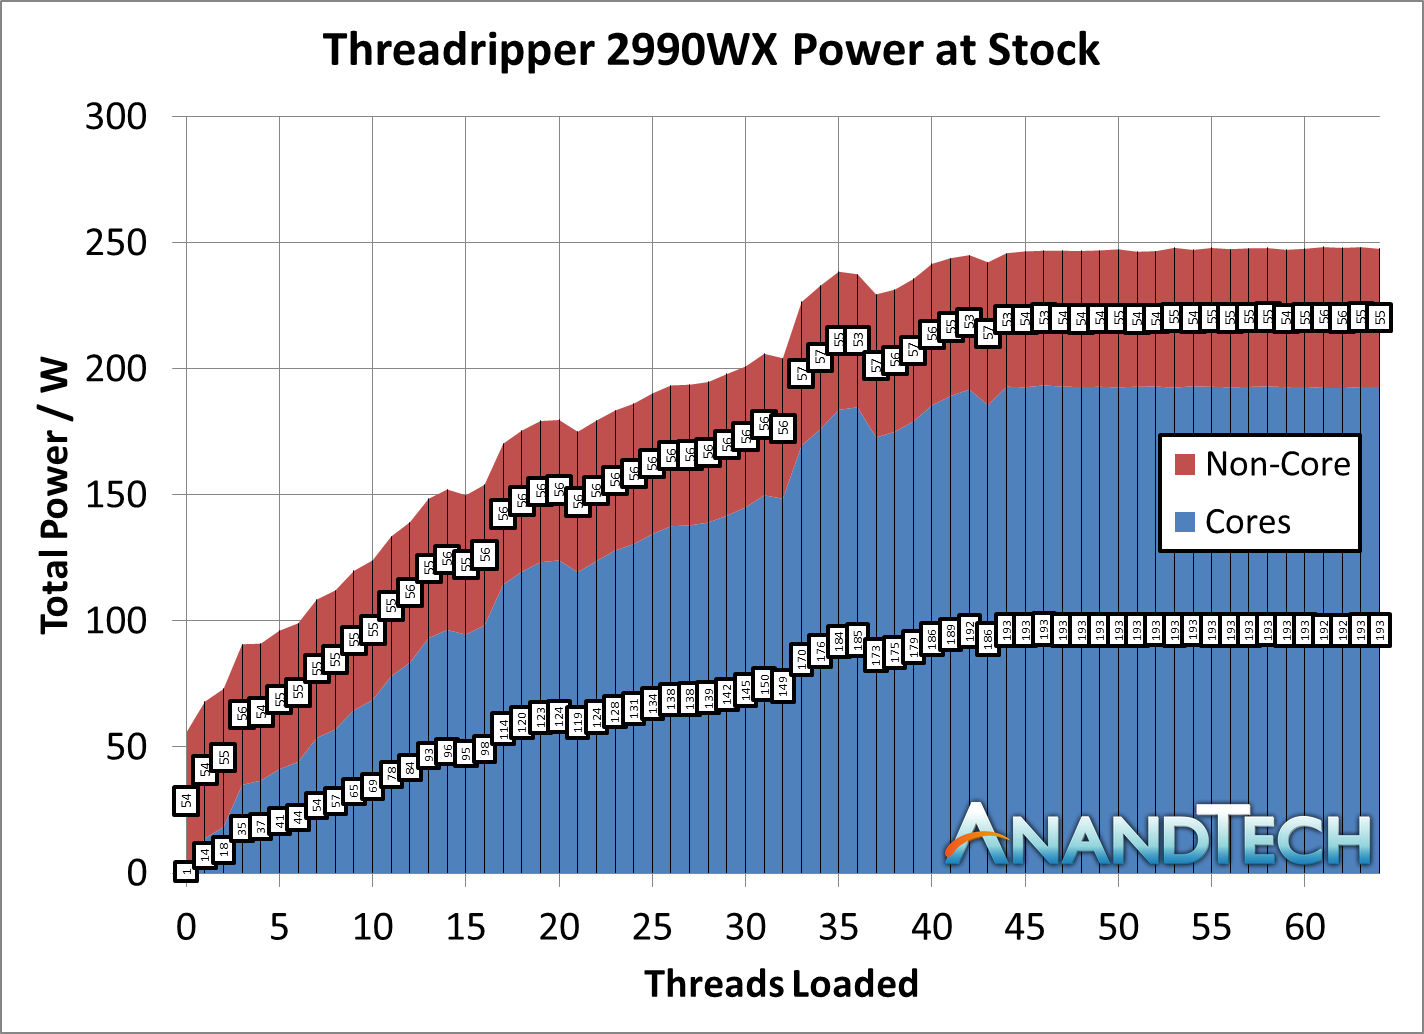
There’s still a good amount of variation in overall loading, with some wobbles, but the data (aside from peak consumption) is broadly in line with our Prime95 test, with the non-core power such as Infinity Fabric consuming 55-60W of the total. As a result we see the non-core power as a percentage of the total power go from 75% with two threads loaded down to 22% by the time 40 threads are loaded.
Overclocking: 4.0 GHz for 500W
Who said that a 250W processor should not be overclocked? AMD prides itself as being a processor manufacturer that offers every consumer processor as a multiplier unlocked part, as well as using a soldered thermal interface material to assist with thermal dissipation performance. This 2990WX has an X in the same, so let the overclocking begin!
Actually, confession time. We did not have much time to do overclocking by any stretch. This processor has a 3.0 GHz base frequency and a 4.2 GHz turbo frequency, and in an air-conditioned room using the 500W Enermax Liqtech cooler, when running all cores under POV-Ray, we observed each core running around 3150 MHz, which is barely above the turbo frequency. The first thing I did was set the all-core turbo to 4.2 GHz, the same as the single core turbo frequency. That was a bust.
However, the next stage of my overclocking escapades surprised me. I set the CPU to a 40x multiplier in the BIOS, for 4.0 GHz on all the cores, all the time. I did not adjust the voltage, it was kept at auto, and I was leaving the ASUS motherboard to figure it out. Lo and behold, it performed flawlessly through our testing suite at 4.0 GHz. I was shocked.
All I did for this overclock was turn a setting from ‘auto’ to ‘40’, and it breezed through almost every test I threw at it. I say almost every test – our Prime95 power testing failed. But our POV-Ray power testing, which draws more power, worked. Every benchmark in the suite worked. Thermals were high (in the 70s), but the cooler could take it, and with good reason too.
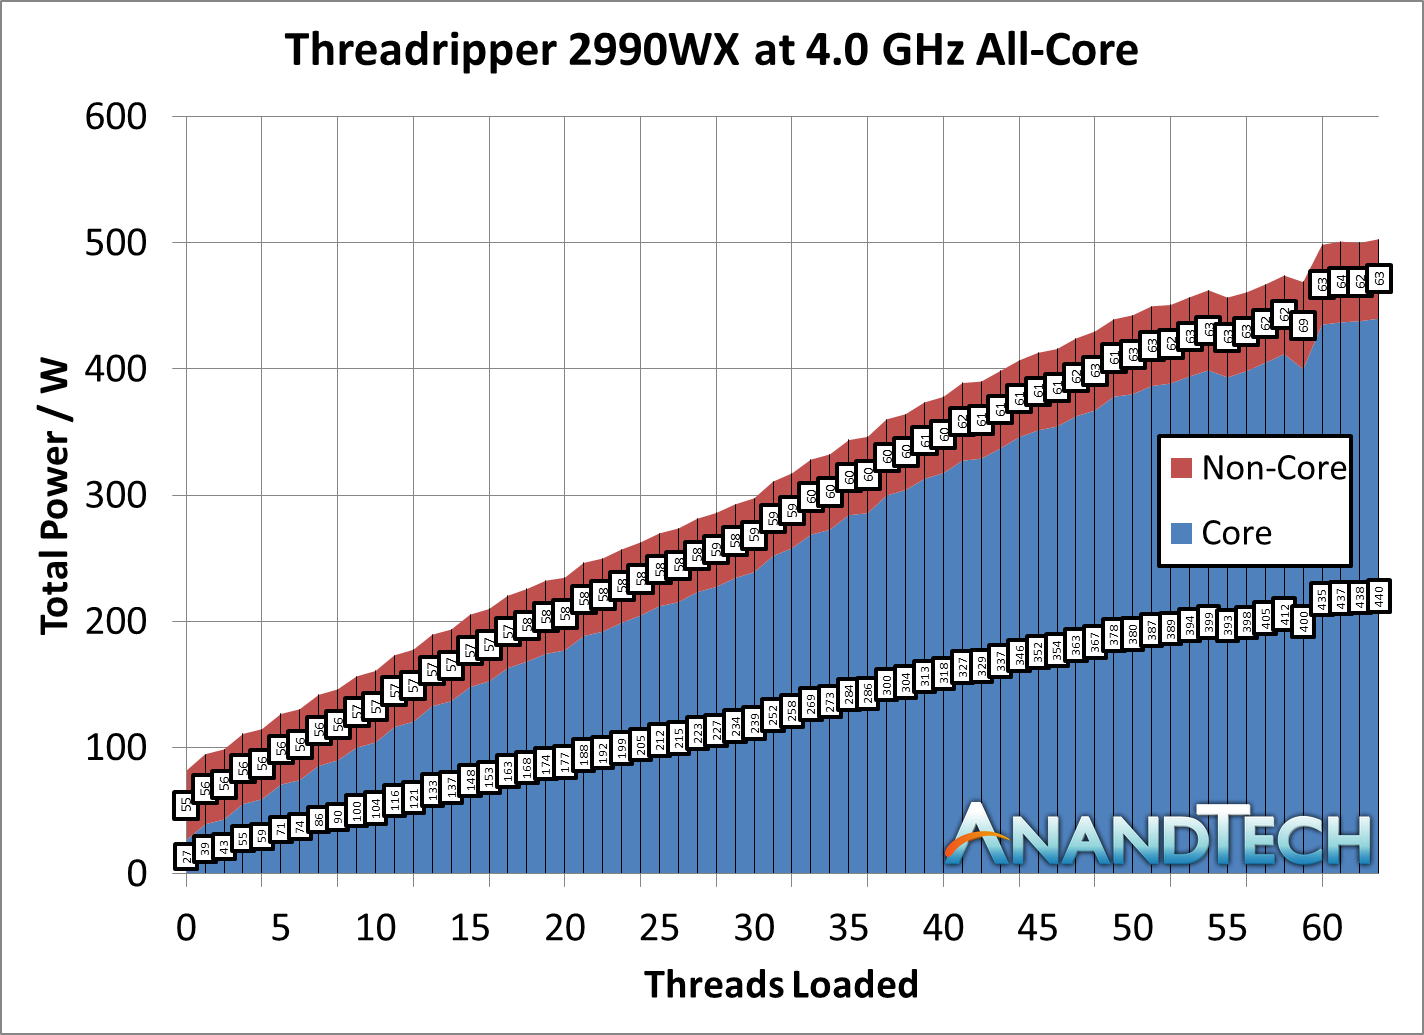
At full load in our POV-Ray test, the processor was listed as consuming 500W. The cooler is rated for 500W. At one point we saw 511W. This was split between 440W for the cores (or 13.8W per core) and 63W for the non-core (IF, IO, IMC) which equates to only 12.5% of the full power consumption. It answers the question from our Infinity Fabric power page - if you want the interconnect to be less of the overall power draw, overclock!
We also tried 4.1 GHz, and that seemed to work as well, although we did not get a full benchmark run out of it before having to pack the system up. As stated above, 4.2 GHz was a no-go, even when increasing the voltage. With tweaking (and the right cooling), it could be possible. For anyone wanting to push here, chilled water might be the way to go.
Performance at 4.0 GHz
So if the all-core frequency was 3125 MHz, an overclock to 4000 MHz all-core should give a 28% performance increase, right? Here are some of the key tests from our suite.
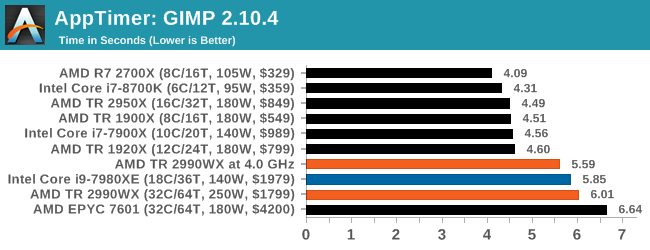
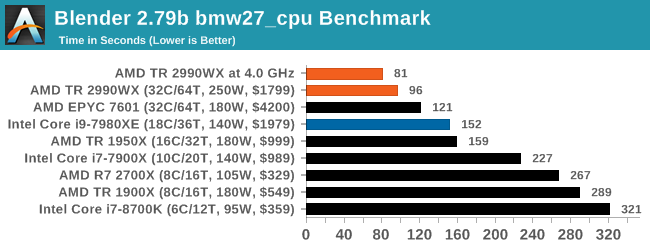
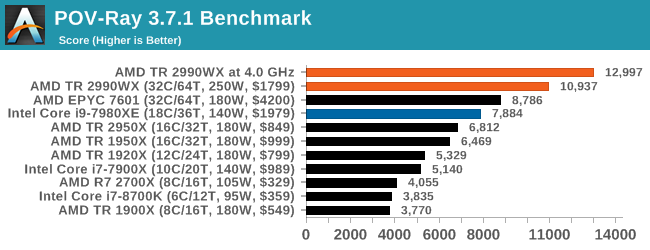
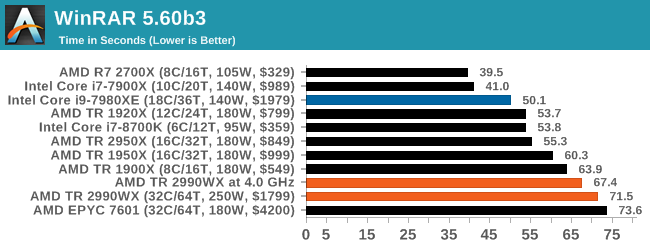
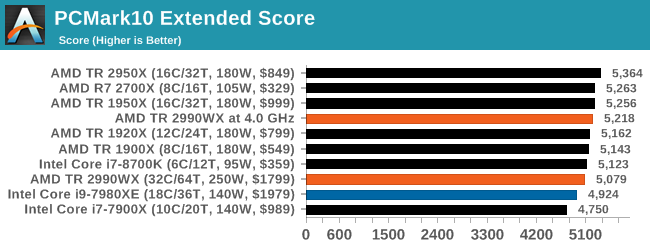
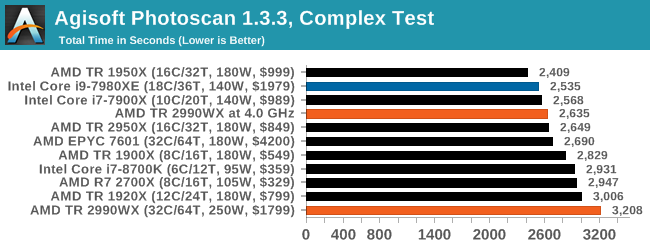
Overclocking the 2990WX is a mixed bag, because of how it does really well in some tests, and how it still sits behind the 2950X in others due to the bi-modal nature of the cores. In the tests were it already wins, it pushes out a lot more: Blender is up 19% in throughput, POV-Ray is up 19%, 3DPM is up 19%. The other tests, is catches back up to the 2950X (Photoscan), or still lags behind (app loading, WinRAR).
Overclocking is not the cure-all for the performance issues on the 2990WX, but it certainly does help.
Thermal Comparisons and XFR2: Remember to Remove the CPU Cooler Plastic!
Every machine build has some targets: performance, power, noise, thermal performance, or cost. It is certainly hard to get all of them, so going after two or three is usually a good target. Well it turns out that there is one simple error that can make you lose on ALL FIVE COUNTS. Welcome to my world of when I first tested the 32-core AMD Ryzen Threadripper 2990WX, where I forgot to remove the plastic from my CPU liquid cooler.
Don’t Build Systems After Long Flights
Almost all brand new CPU coolers, either air coolers, liquid coolers, or water blocks, come pre-packaged with padding, foam, screws, fans, and all the instructions. Depending on the manufacturer, and the packaging type, the bottom of the CPU cooler will have been prepared in two ways:
- Pre-applied thermal paste
- A small self-adhesive plastic strip to protect the polishing during shipping
In our review kit, the Wraith Ripper massive air cooler, made by Cooler Master but promoted by AMD as the ‘base’ air cooler for new Threadripper 2 parts, had pre-applied thermal paste. It was across the whole base, and it was thick. It made a mess when I tried to take photos.
Also in our review kit was the Enermax Liqtech TR4 closed loop liquid cooler, with a small tube of thermal paste included. The bottom of the CPU block for the liquid cooler was covered in a self-adhesive plastic strip to protect the base in the packaging.

Example from TechTeamGB's Twitter
So confession time. Our review kit landed the day before I was travelling from the UK to San Francisco, to cover Flash Memory Summit and Intel’s Datacenter Summit. In my suitcases, I took an X399 motherboard (the ASUS ROG Zenith), three X399 chips (2990WX, 2950X, 1950X), an X299 motherboard (ASRock X299 OC Formula), several Skylake-X chips, a Corsair AX860i power supply, an RX 460 graphics card, mouse, keyboard, cables – basically two systems and relying on the monitor in the hotel room for testing. After an 11 hour direct flight, two hours at passport control, a one hour Uber to my hotel, I set up the system with the 2990WX.
I didn’t take off the plastic on the Enermax cooler. Well, I didn’t realize it at the time. I even put thermal paste on the processor, and it still didn’t register when I tightened the screws.
I set the system up at the maximum supported memory frequency, installed Windows, installed the security updates, installed the benchmarks, and set it to run overnight while I slept. I didn’t even realize the plastic was still attached. Come mid-morning, the benchmark suite had finished. I did some of the extra testing, such as base frequency latency measurements, and then went to replace the processor with the 2950X. It was at this time I performed a facepalm.

It was at that point, with thermal paste all over the processor and the plastic, I realized I done goofed. I took the plastic off, re-pasted the processor, and set the system up again, this time with a better thermal profile. But rather than throw the results away, I kept them.
Thermal Performance Matters
The goal of any system is to keep it with a sufficient thermal window to maintain operation: most processors are rated to work properly from normal temperatures up to 105C, at which point they shut down to avoid permanent thermal damage. When a processor shuttles electrons around and does things, it consumes power. That power is lost as heat, and it dissipates from the silicon out into two main areas: the socket and the heatspreader.
For AMD’s Threadripper processors, the thermal interface material between the silicon dies and the heatspreader is an indium-tin solder, a direct metal-to-metal bonding for direct heat transfer. Modern Intel processors use a silicone thermal grease instead, which is not as great, but has one benefit – it lasts longer through thermal cycling. As metals heat up, they expand: with two metals bonded together, with different thermal expansion coefficients, with enough heat cycles will crack and be ineffective – thermal grease essentially eliminates that issue. Thermal grease also happens to be cheaper. So it’s a trade-off between price/longevity and performance.
Above the heatspreader is the CPU cooler, but between the two is another thermal interface which the user can decide. The cheapest options involve nasty silicone thermal grease that costs cents per gallon, however performance enthusiasts might look towards a silver based thermal paste or a compound with good heat transfer characteristics – usually the ability for a paste to spread under pressure is a good quality. Extreme users can implement a liquid metal policy, similar to that of the solder connection, which binds the CPU to the CPU cooler pretty much permanently.
So what happens if you suddenly put some microns of thermally inefficient plastic between the heatspreader and the CPU cooler?
First of all, the conductive heat transfer is terrible. This means that the thermal energy stays in the paste and headspreader for longer, causing heat soak in the processor, raising temperatures. This is essentially the same effect when a cooler is overwhelmed by a large processor – heat soak is real and can be a problem. It typically leads to a runaway temperature rise, until the temperature gradient can equal the heat energy output. This is when a processor gets too hot, and typically a thermal emergency power state kicks in, reducing voltage and frequency to super low levels. Performance ends down the drain.
What does the user see in the system? Imagine a processor hitting 600 MHz while rendering, rather than a nice 3125 MHz at stock (see previous page). Base temperatures are higher, load temperatures are higher, case temperatures are higher. Might as well dry some wet clothes in there while you are at it. A little thermal energy never hurt a processor, but a lot can destroy an experience.
AMD’s XFR2
Ultimately this issue hurts AMD more than you might think. The way AMD implements its turbo modes is not a look-up-table where cores loaded equals turbo frequency – it relies on power, current, and thermal limits of a given chip. Where there is room, the AMD platform is designed to add frequency and voltage where possible. The thermal aspect of this is what AMD calls XFR2, or eXtended Frequency Range 2.
At AMD’s Tech Day for Threadripper 2, we were presented with graphs showing the effects of using better coolers on performance: around 10% better benchmark results due to having higher thermal headroom. Stick the system in an environment with a lower ambient temperature as well, and AMD quoted a 16% performance gain over a ‘stock’ system.
However, the reverse works too. By having that bit of plastic in there, what this effectively did was lower that thermal ceiling, from idle to load, which should result in a drop in performance.
Plastic Performance
So despite being in a nice air-conditioned hotel room, that additional plastic did a number on most of our benchmarks. Here is the damage:
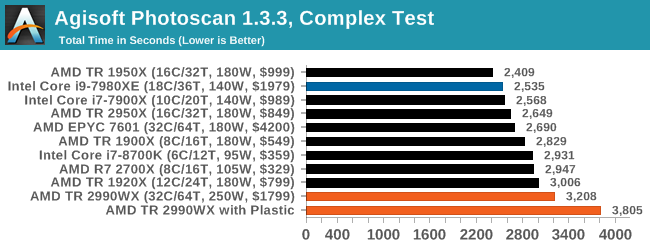
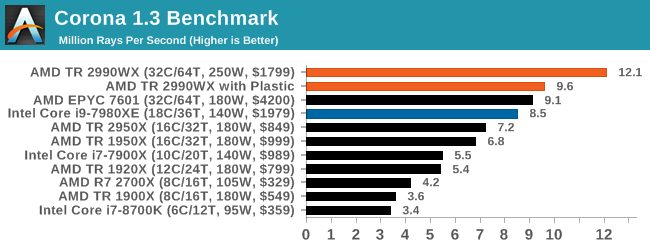
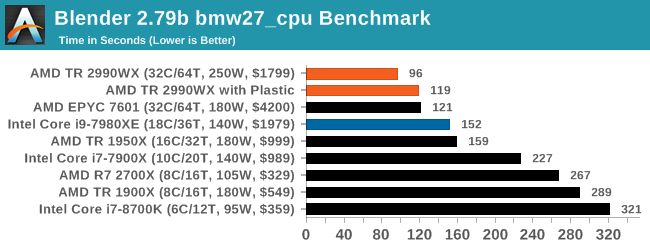
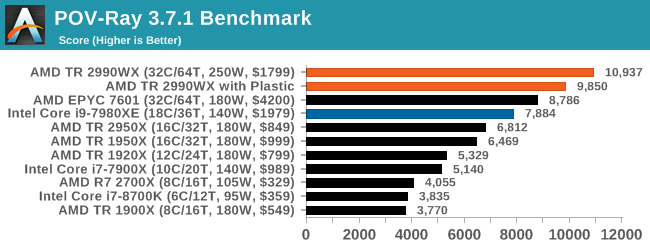

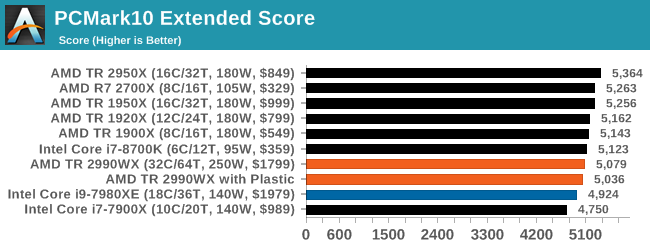
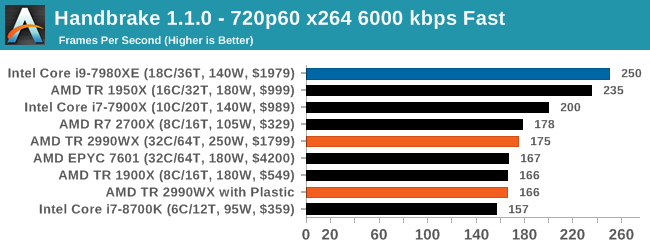
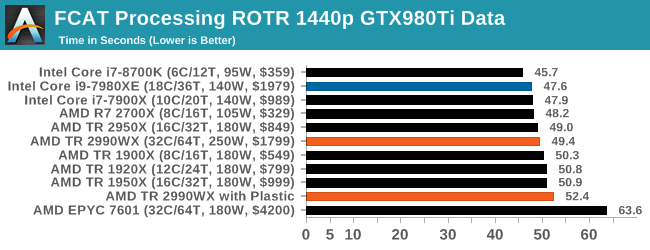
For all of our multi-threaded tests, where the CPU is hammered hard, there is a significant decrease in performance as expected. Blender saw a 20% decrease in throughput, POV-Ray was 10% lower, 3DPM was 19%. PCMark was only slightly lower, as it has a lot of single threaded tests, and annoyingly in some benchmarks we saw it swing the other way, such as WinRAR, which is more DRAM bound. Other benchmarks not listed include our compile test, where the plasticated system was 1% slower, or Dolphin, where there was a one-second difference.
What Have I Learned?
Don’t be a fool. Building a test bed with new components when super tired may lead to extra re-tests.
Conclusions: Not All Cores Are Made Equal
Designing a processor is often a finely tuned craft. To get performance, the architect needs to balance compute with throughput and at all times have sufficient data in place to feed the beast. If the beast is left idle, it sits there and consumes power, while not doing any work. Getting the right combination of resources is a complex task, and the reason why top CPU companies hire thousands of engineers to get it to work right. As long as the top of the design is in place, the rest should follow.
Sometimes, more esoteric products fall out of the stack. The new generation of AMD Ryzen Threadripper processors are just that – a little esoteric. The direct replacements for the previous generation units, replacing like for like but with better latency and more frequency, are a known component at this point and we get the expected uplift. It is just this extra enabled silicon in the 2990WX, without direct access to memory, is throwing a spanner in the works.
2950X (left) and 2990WX (right)
When some cores are directly connected to memory, such as the 2950X, all of the cores are considered equal enough that distributing a workload is a fairly easy task. With the new processors, we have the situation on the right, where only some cores are directly attached to memory, and others are not. In order to go from one of these cores to main memory, it requires an extra hop, which adds latency. When all the cores are requesting access, this causes congestion.
In order to take the full advantage of this setup, the workload has to be memory light. In workloads such as particle movement, ray-tracing, scene rendering, and decompression, having all 32-cores shine a light means that we set new records in these benchmarks.
In true Janus style, for other workloads that are historically scale with cores, such as physics, transcoding, and compression, the bi-modal core caused significant performance regression. Ultimately, there seems to be almost no middle ground here – either the workload scales well, or it sits towards the back of our high-end testing pack.
Part of the problem relates to how power is distributed with these big core designs. As shown on page four, the more chiplets that are in play, or the bigger the mesh, the more power gets diverted from the cores to the internal networking, such as the uncore or Infinity Fabric. Comparing the one IF link in the 2950X to the six links in 2990WX, we saw the IF consuming 60-73% of the chip power total at small workloads, and 25-40% at high levels.
In essence, at full load, a chip like the 2990WX is only using 60% of its power budget for CPU frequency. In our EPYC 7601, because of the additional memory links, the cores were only consuming 50% of the power budget at load. Rest assured, once AMD and Intel have finished fighting over cores, the next target on their list will be this interconnect.
But the knock on effect of not using all the power for the cores, as well as having a bi-modal operation of cores, is that some workloads will not scale: or in some cases regress.
The Big Cheese: AMD’s 32-Core Behemoth
There is no doubting that when the AMD Ryzen Threadripper 2990WX gets a change to work its legs, it will do so with gusto. We were able to overclock the system to 4.0 GHz on all cores by simply changing the BIOS settings, although AMD also supports features like Precision Boost Overdrive in Windows to get more out of the chip. That being said, the power consumption when using half of the cores at 4.0 GHz pushes up to 260W, leaving a full loaded CPU nudging 450-500W and spiking at over 600W. Users will need to make sure that their motherboard and power supply are up to the task.
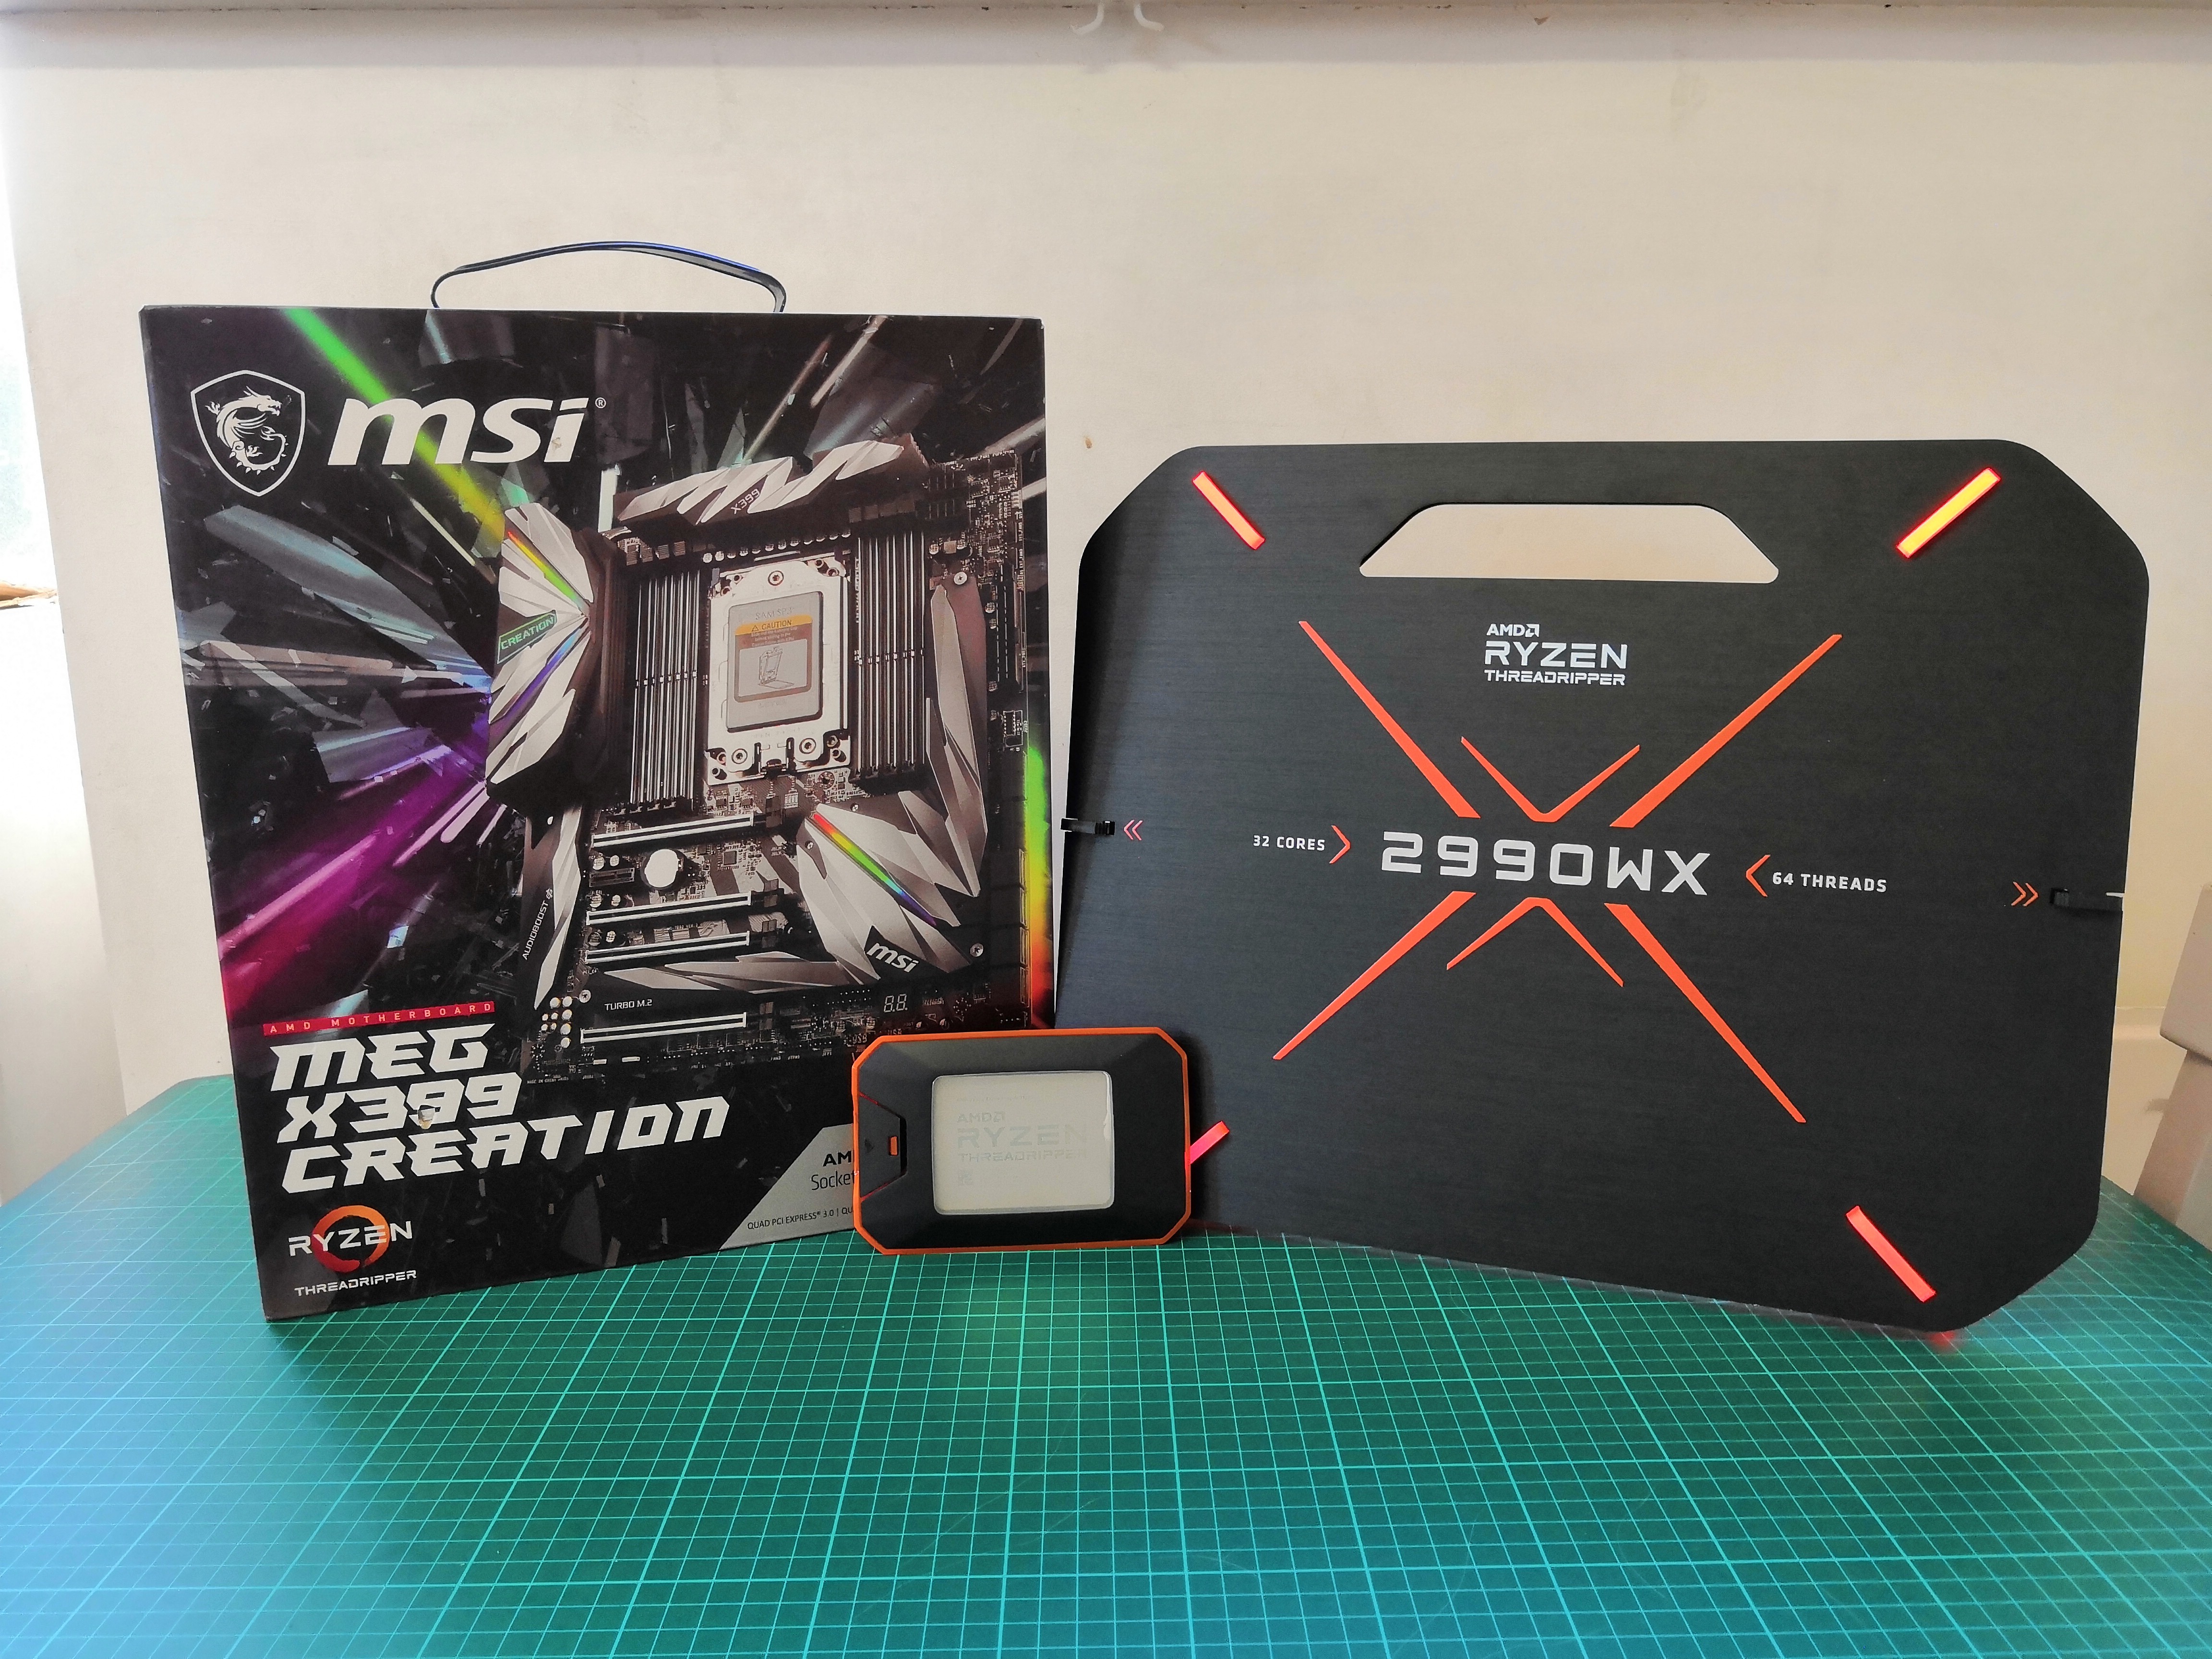
This is the point where I mention if we would recommend AMD’s new launches. The 2950X slots right in to where the 1950X used to be, and at a lower price point, and we are very comfortable with that. However the 2950X already sits as a niche proposition for high performance – the 2990WX takes that ball and runs with it, making it a niche of a niche. To be honest, it doesn’t offer enough cases where performance excels as one would expect – it makes perfect sense for a narrow set of workloads where it toasts the competition. It even outperforms almost all the other processors in our compile test. However there is one processor that did beat it: the 2950X.
For most users, the 2950X is enough. For the select few, the 2990WX will be out of this world.


