Original Link: https://www.anandtech.com/show/11697/the-amd-ryzen-threadripper-1950x-and-1920x-review
The AMD Ryzen Threadripper 1950X and 1920X Review: CPUs on Steroids
by Ian Cutress on August 10, 2017 9:00 AM EST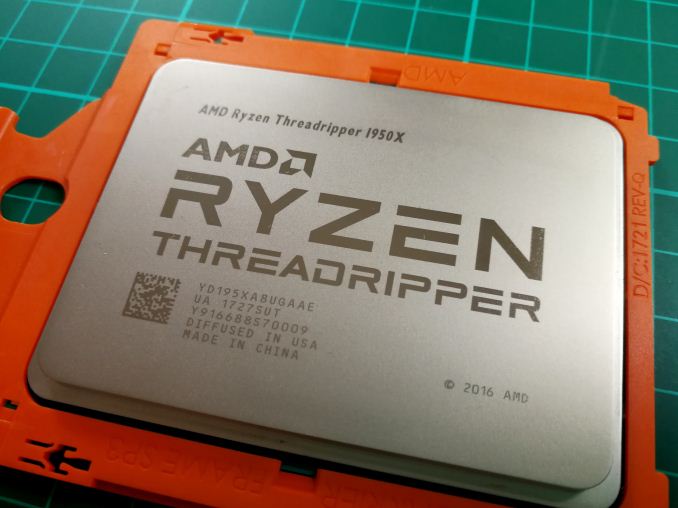
In the early 2000s, we had the battle to high frequencies. The company that could force the most cycles through a processor could get a base performance advantage over the other, and it led to some rather hot chips, with the certain architectures being dropped for something that scaled better. Move on 10-15 years and we are now at the heart of the Core Wars: how many CPU cores with high IPC can you fit into a consumer processor? Up to today, the answer was 10, but now AMD is pushing the barrier to 16 with its new Threadripper processors. We got both of the launch CPUs for review and put them on the grill.
The New World Order
Earlier in the year, AMD launched their new CPU microarchitecture, Zen. This was implemented into the Ryzen series of CPUs, aiming squarely at Intel’s high-end desktop market first. The three members of the Ryzen 7 family all had eight cores with hyperthreading, and scored highly in performance per dollar, achieving performance near comparable Intel processors at half the price (or better). Next came four Ryzen 5 CPUs, competing in price against the quad core i5 parts, and for that price Ryzen 5 had twelve threads, triple that of Core i5. Finally Ryzen 3 hit the ~$120 market against the Core i3s, with double the cores over Intel. We also saw AMD’s EPYC family officially launch into the enterprise space, offering up to 32 cores, and is being rolled out over the next few months as OEMs and customers test and scale their performance.
- The AMD Zen and Ryzen 7 Review: A Deep Dive on 1800X, 1700X and 1700
- The AMD Ryzen 5 1600X vs Core i5 Review: Twelve Threads vs Four at $250
- The AMD Ryzen 3 1300X and Ryzen 3 1200 CPU Review: Zen on a Budget
- Intel's Skylake-SP Xeon versus AMD's EPYC 7000 - The Server CPU Battle of the Decade
Out of the gate today is AMD’s Ryzen Threadripper family, or Threadripper for short. These CPUs take a similar design as the AMD EPYC processors, but for a consumer platform. The first two CPUs are the 1950X and 1920X, with 16 and 12 cores respectively, to be then followed by the 8 core 1900X on August 31st, and the 1920 at sometime unknown. These parts will fit into the LGA-style TR4 socket, containing 4094-pins. This socket is identical (but not interchangeable) to the SP3 socket used for EPYC, and a large step over the 1331-pin PGA-style AM4 socket for the Ryzen 7/5/3 processors.
| AMD Ryzen SKUs | |||||||||
| Cores/ Threads |
Base/ Turbo |
XFR | L3 | DRAM 1DPC |
PCIe | TDP | SRP | Cooler | |
| TR 1950X | 16/32 | 3.4/4.0 | +200* | 32 MB | 4x2666 | 60 | 180W | $999 | - |
| TR 1920X | 12/24 | 3.5/4.0 | +200* | 32 MB | 4x2666 | 60 | 180W | $799 | - |
| TR 1920** | 12/24 | 3.2/3.8 | ? | 32 MB | 4-Ch? | 60 | 140W | ? | - |
| TR 1900X | 8/16 | 3.8/4.0 | +200 | 16 MB* | 4x2666* | 60 | 180W* | $549 | - |
| Ryzen 7 1800X | 8/16 | 3.6/4.0 | +100 | 16 MB | 2x2666 | 16 | 95 W | $499 | - |
| Ryzen 7 1700X | 8/16 | 3.4/3.8 | +100 | 16 MB | 2x2666 | 16 | 95 W | $399 | - |
| Ryzen 7 1700 | 8/16 | 3.0/3.7 | +50 | 16 MB | 2x2666 | 16 | 65 W | $329 | Spire |
| Ryzen 5 1600X | 6/12 | 3.6/4.0 | +100 | 16 MB | 2x2666 | 16 | 95 W | $249 | - |
| Ryzen 5 1600 | 6/12 | 3.2/3.6 | +100 | 16 MB | 2x2666 | 16 | 65 W | $219 | Spire |
| Ryzen 5 1500X | 4/8 | 3.5/3.7 | +200 | 16 MB | 2x2666 | 16 | 65 W | $189 | Spire |
| Ryzen 5 1400 | 4/8 | 3.2/3.4 | +50 | 8 MB | 2x2666 | 16 | 65 W | $169 | Stealth |
| Ryzen 3 1300X | 4/4 | 3.5/3.7 | +200 | 8 MB | 2x2666 | 16 | 65 W | $129 | Stealth |
| Ryzen 3 1200 | 4/4 | 3.1/3.4 | +50 | 8 MB | 2x2666 | 16 | 65 W | $109 | Stealth |
* New information from AMD from our last piece
** Unannounced product, specifications subject to change
Where Ryzen 7 was aiming for Intel’s high-end desktop (HEDT) market share, Threadripper is designed to go above and beyond this, into a ‘super high-end desktop’ market (SHED). The core counts that AMD are releasing with Threadripper were only traditionally seen on Intel’s server line, which features up to 28 cores for a $10000 outlay. By bringing higher-core count parts, with reasonable IPC, frequency, and power numbers, AMD is fudging the line between consumer, prosumer, and enterprise. To compete, Intel announced that their Skylake-X platform will be coming out with 12, 14, 16 and 18 core parts over the next few months.
Similar to Intel’s biggest chips, AMD is aiming Threadripper into the hands of users who want to do everything all the time. For home users, that might mean gaming while streaming (transcoding and uploading in real-time) while also hosting a game server and all other things besides. For prosumers it means video production or compute throughput using several GPUs/FPGAs mixed in with fast storage and networking. The idea is that if the user has something that needs doing, they can also use their system to do other things at the same time and have sufficient CPU grunt, PCIe slots, storage, and DRAM to power it all. Threadripper is, after all, derrived from a design for a server CPU, and accordingly it never strays too far from the high performance-density aspects that have defined servers over the last decade.
New Socket, New Motherboards
Again, similar to Intel’s HEDT platform, AMD is launching the X399 platform alongside Threadripper to provide the necessary tools. The large TR4 socket and all of its pins gives quad-channel memory with two DIMMs per channel, along with up to 60 PCIe lanes for add-in cards (Video cards, NICs, SSDs, etc). These motherboards currently support the two Threadripper CPUs launched today, one more CPU to be launched at the end of the month, and another CPU that has been leaked but not announced (with an unknown release date).
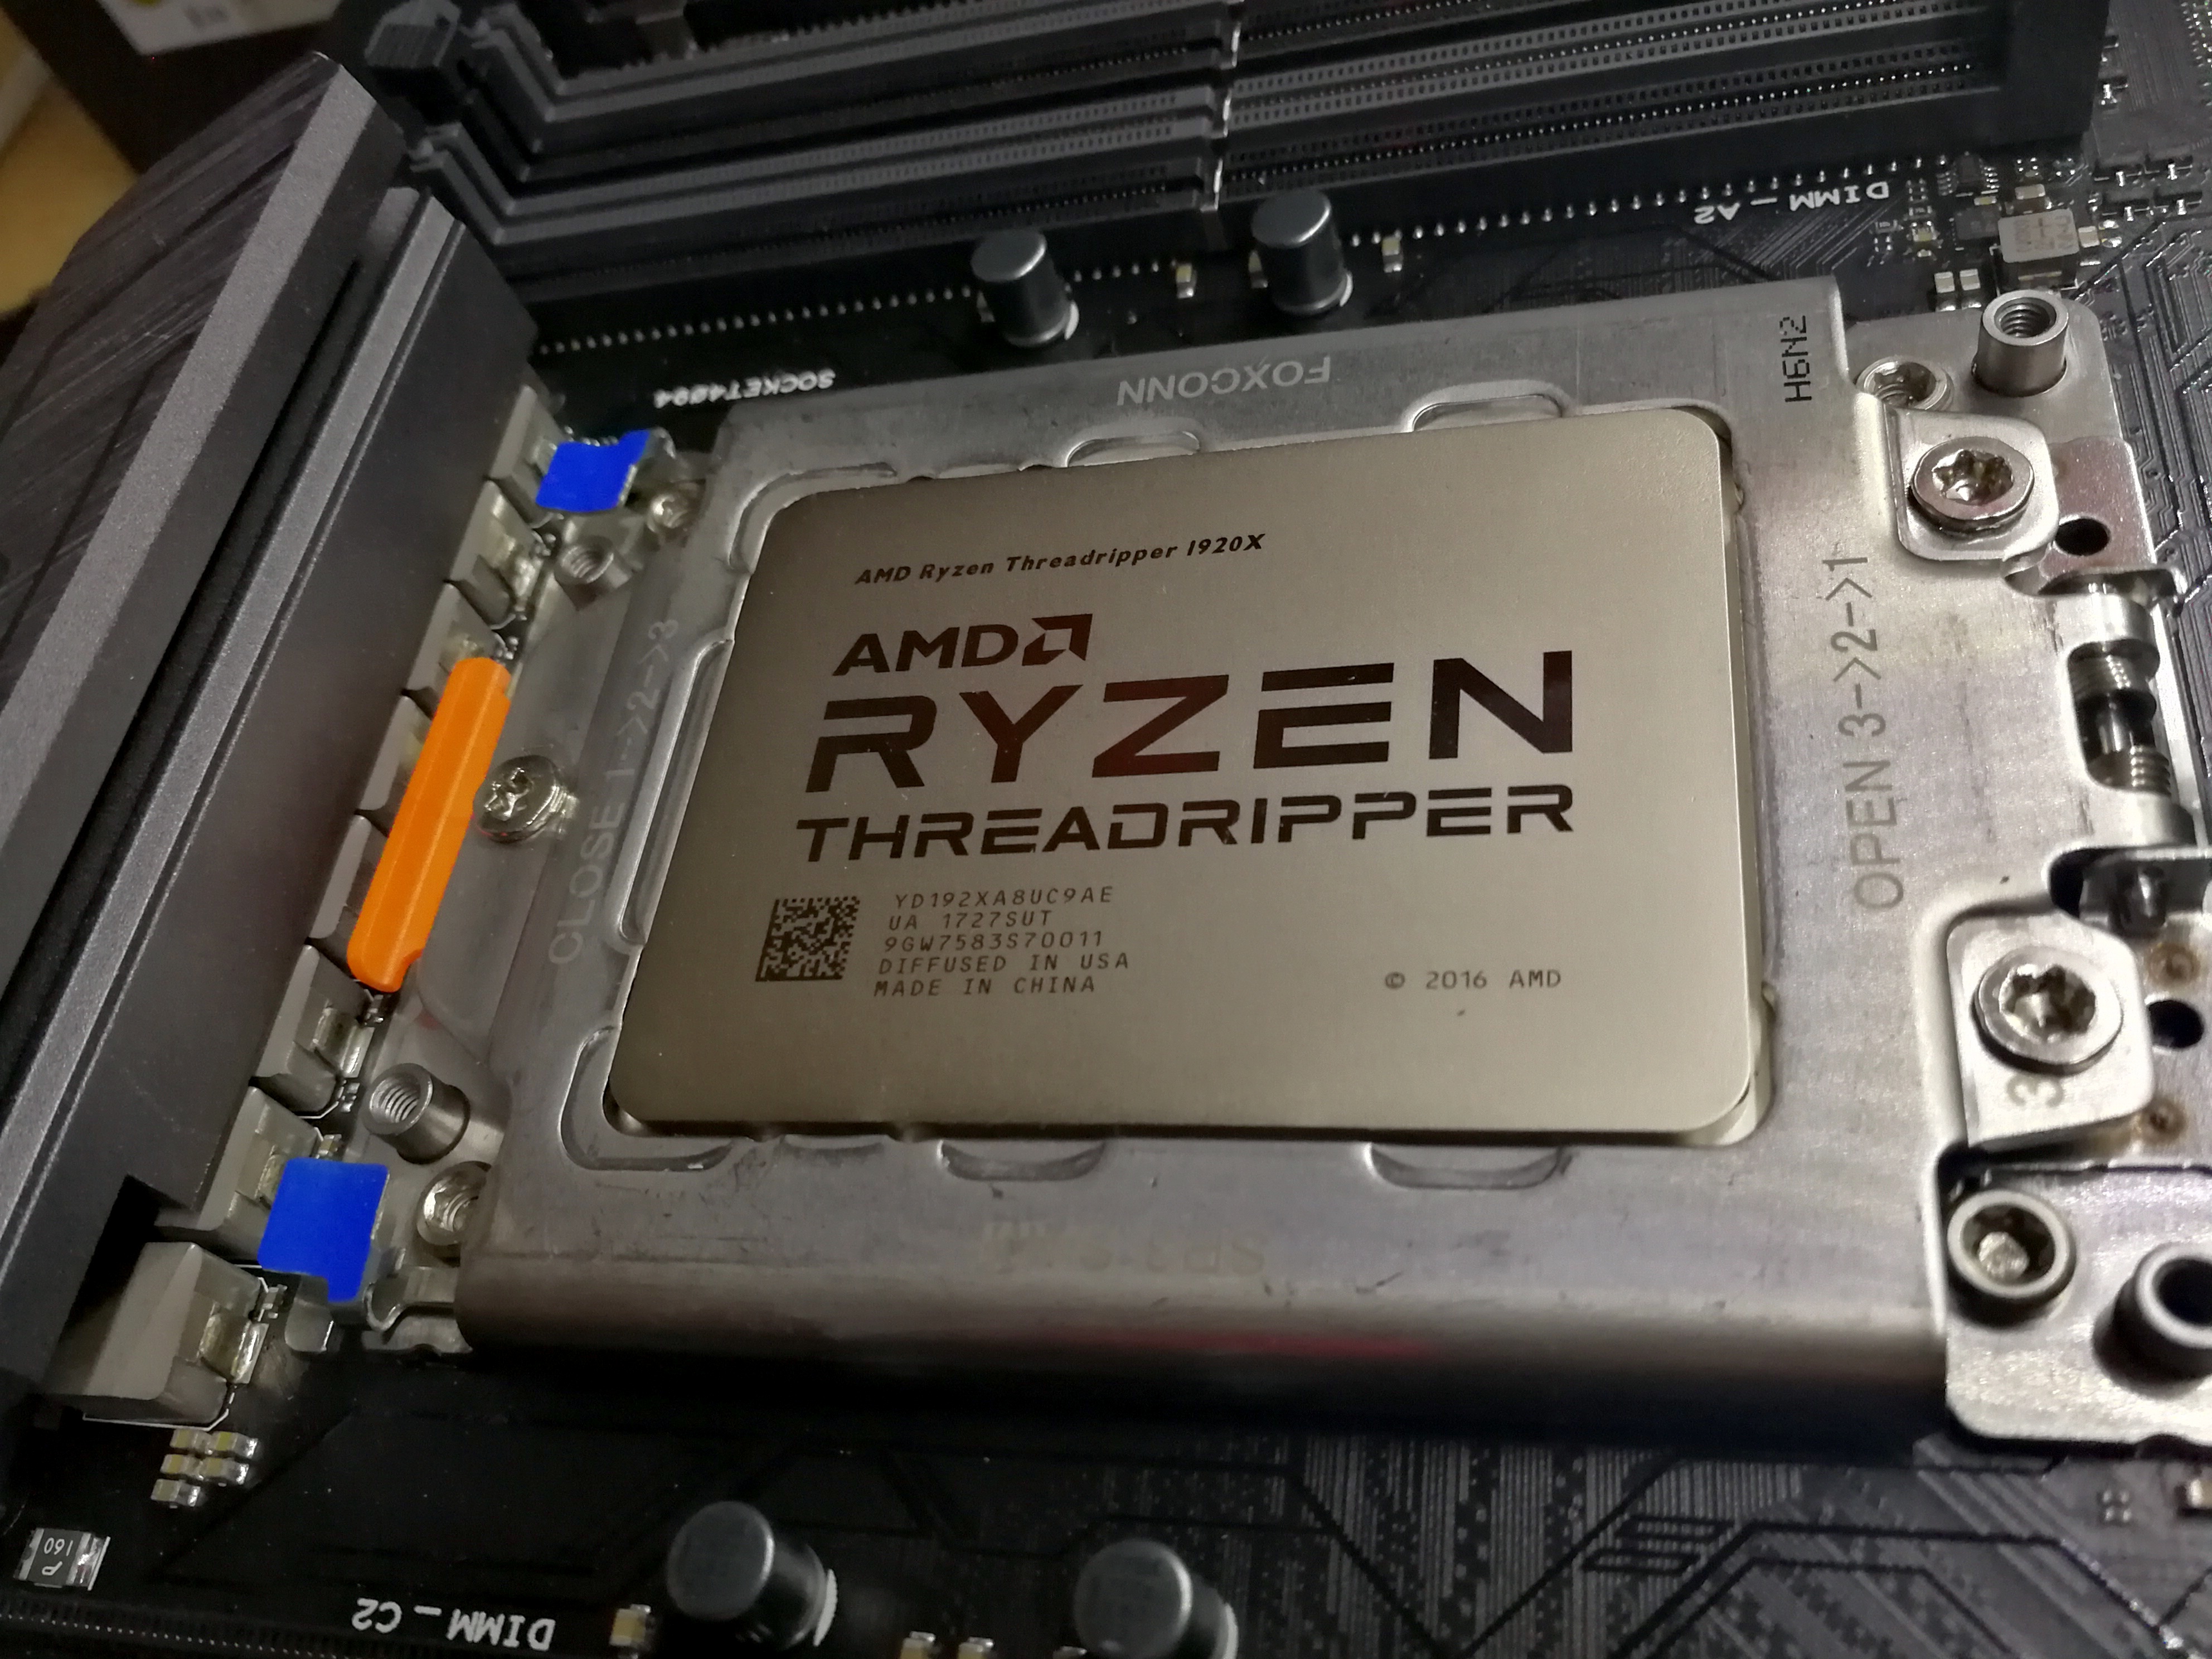
The socket is different to previous AMD sockets, showcasing how much of a step up this is. Rather than a PGA socket with a simple latch system to provide enough force between the pads and pins, the LGA TR4 socket has three Torx screws that should be removed in order – one on the left of the picture above and two on the right. The socket bracket immediately flips open, with a small tray – this tray takes the CPU. All of the Threadripper CPUs will come in this little tray, and there’s no need to take it out of the tray.
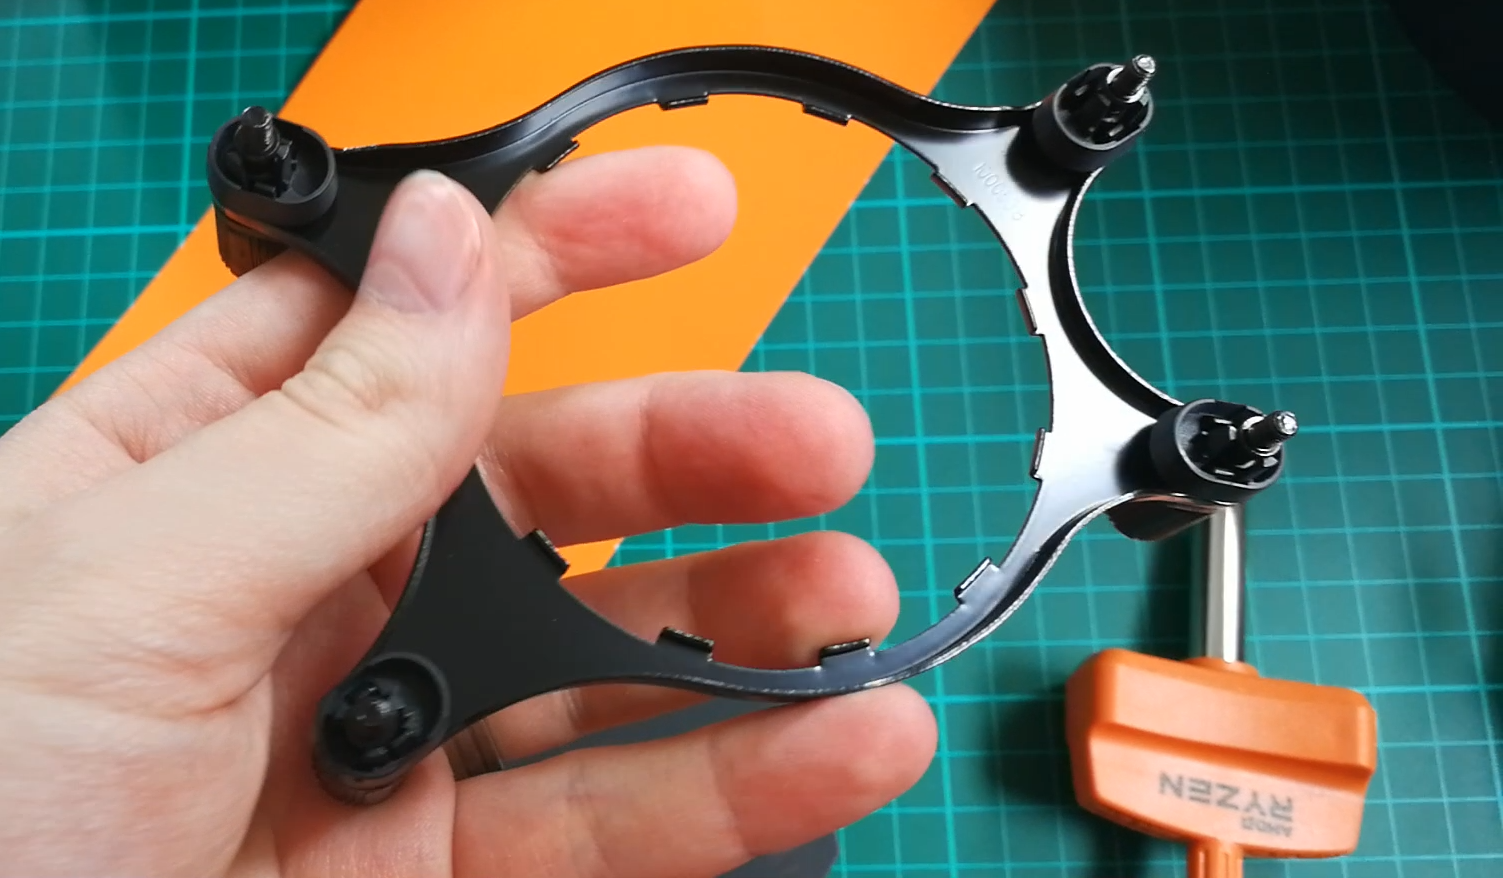
Because of the design of the socket and the size of the CPUs, the screw holes for CPU coolers are different as well. As each CPU is currently geared for 180W, AMD recommends liquid cooling at a bare minimum, and will bundle an Asetek CPU bracket with every CPU sold (a Torx screwdriver is also supplied).
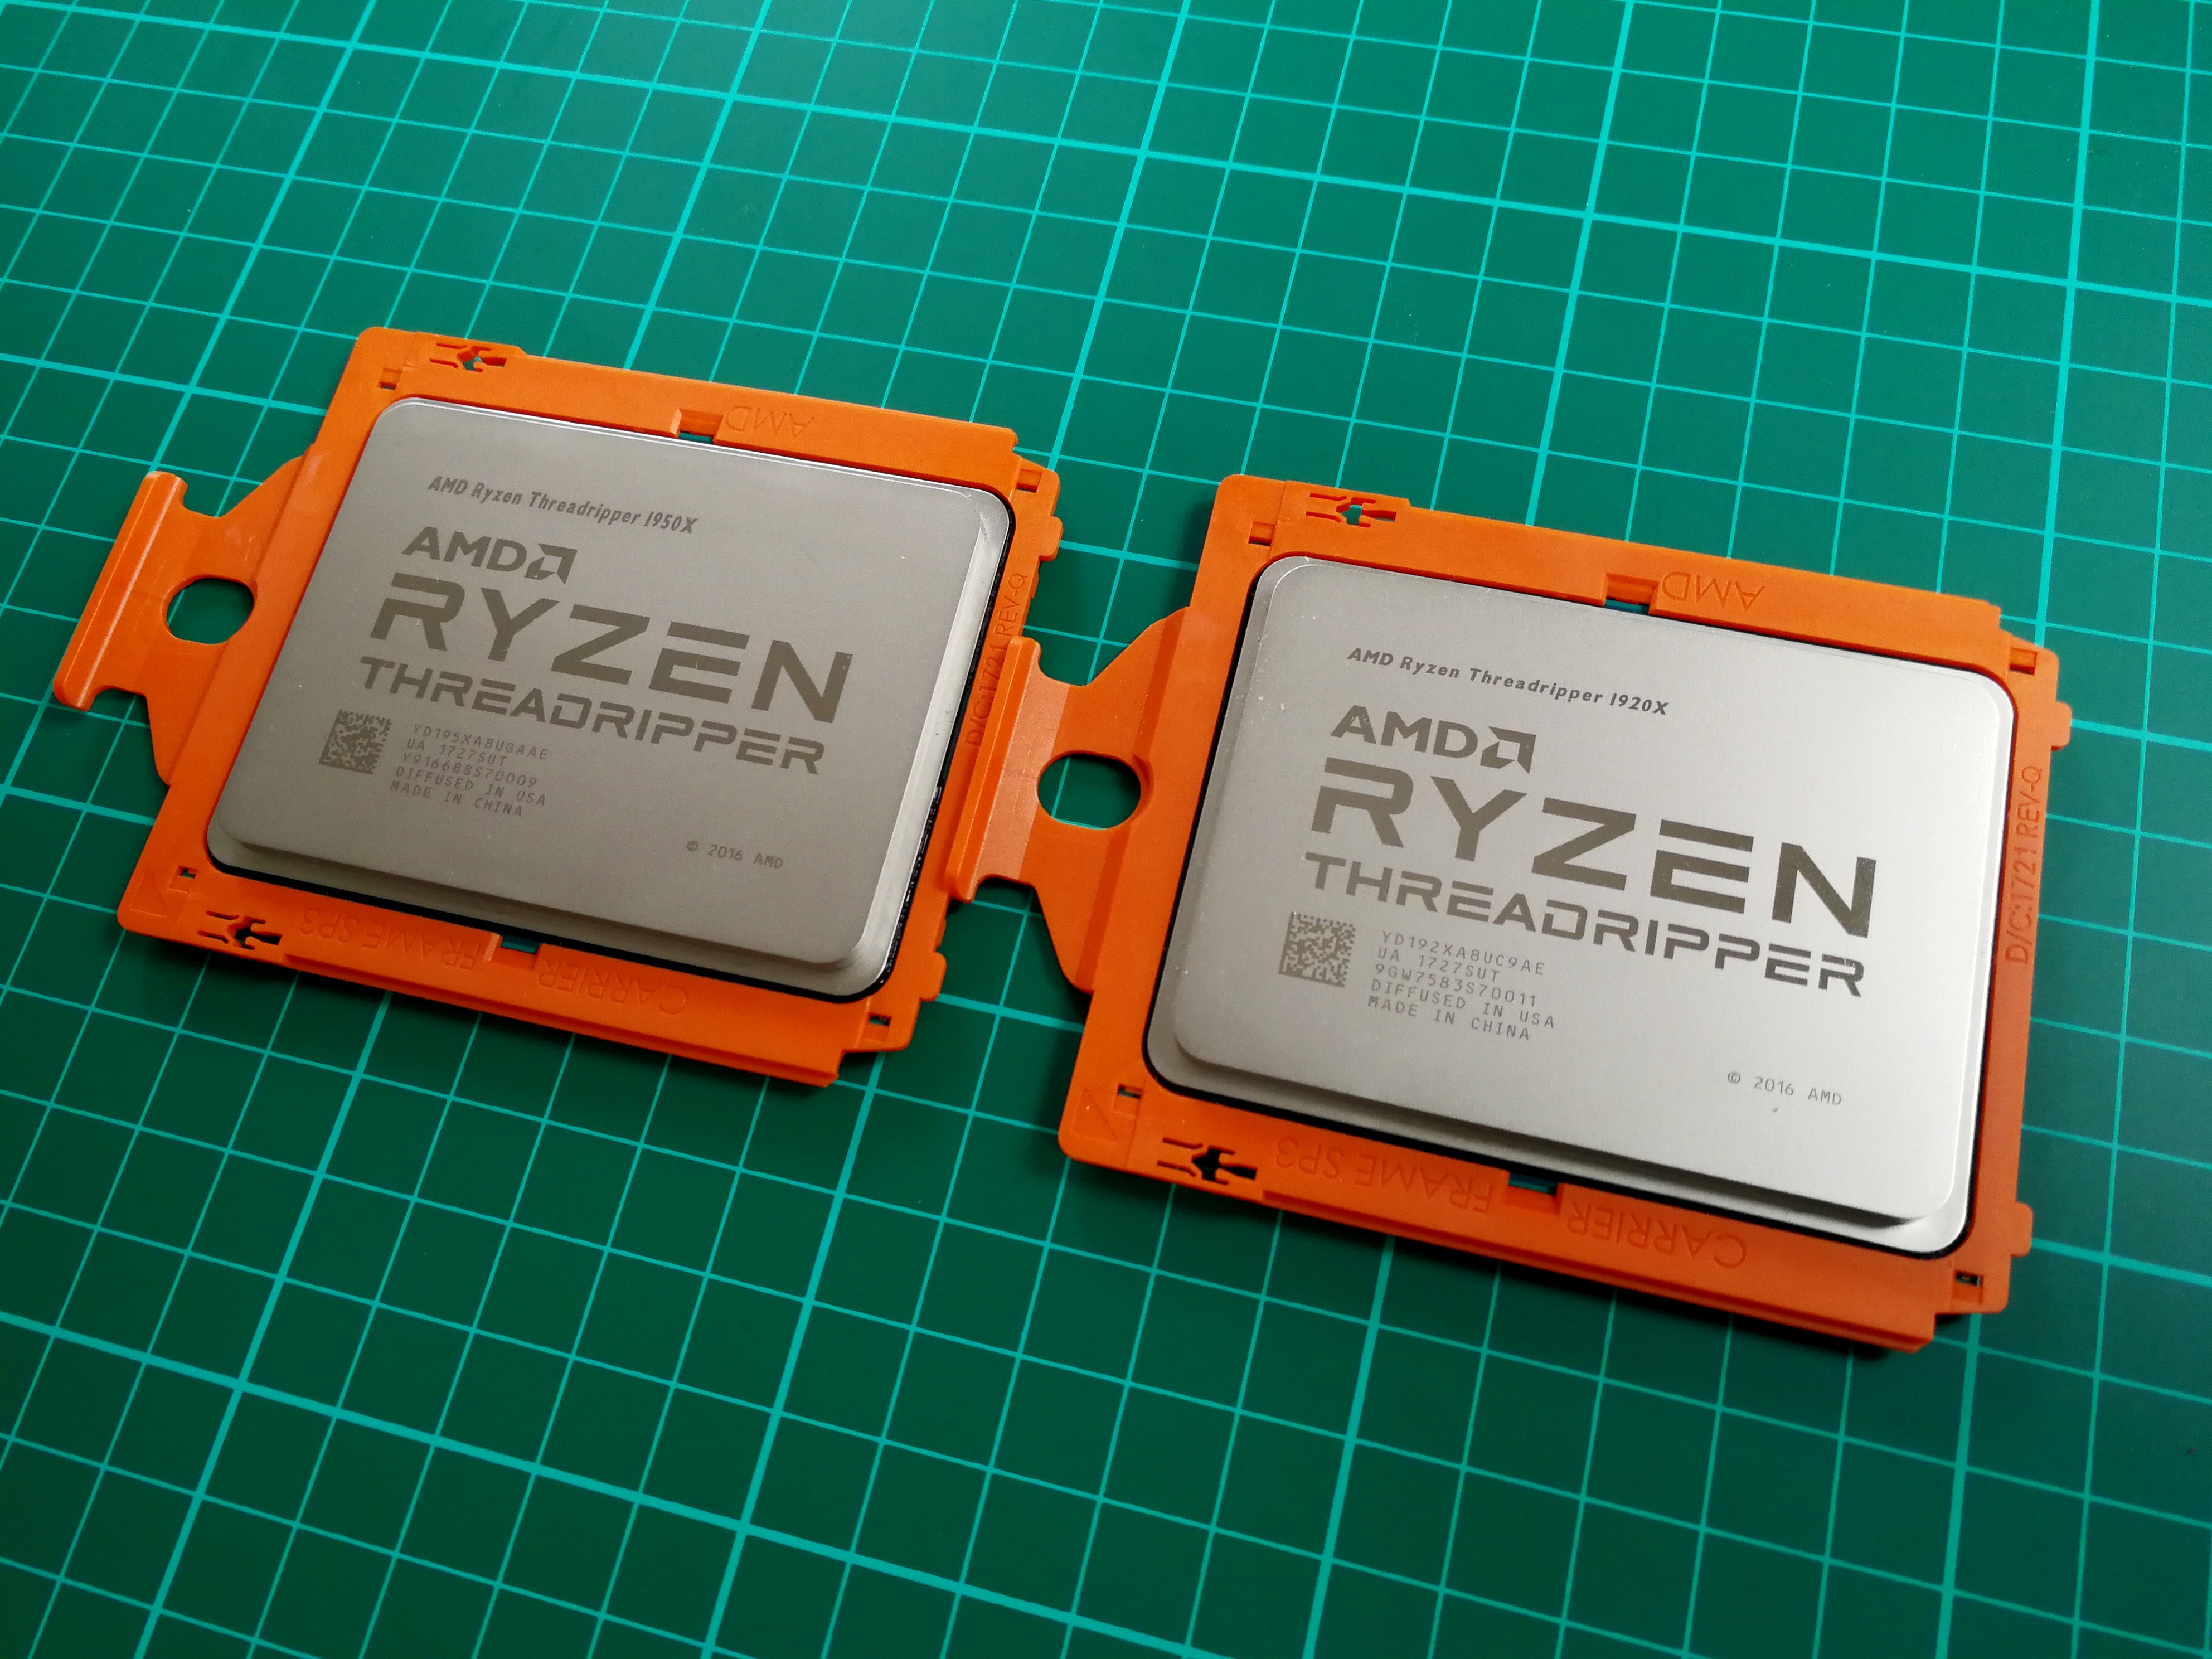
The bracket is narrower on one end, which indicates the ‘top’ of the socket in a traditional motherboard shot.
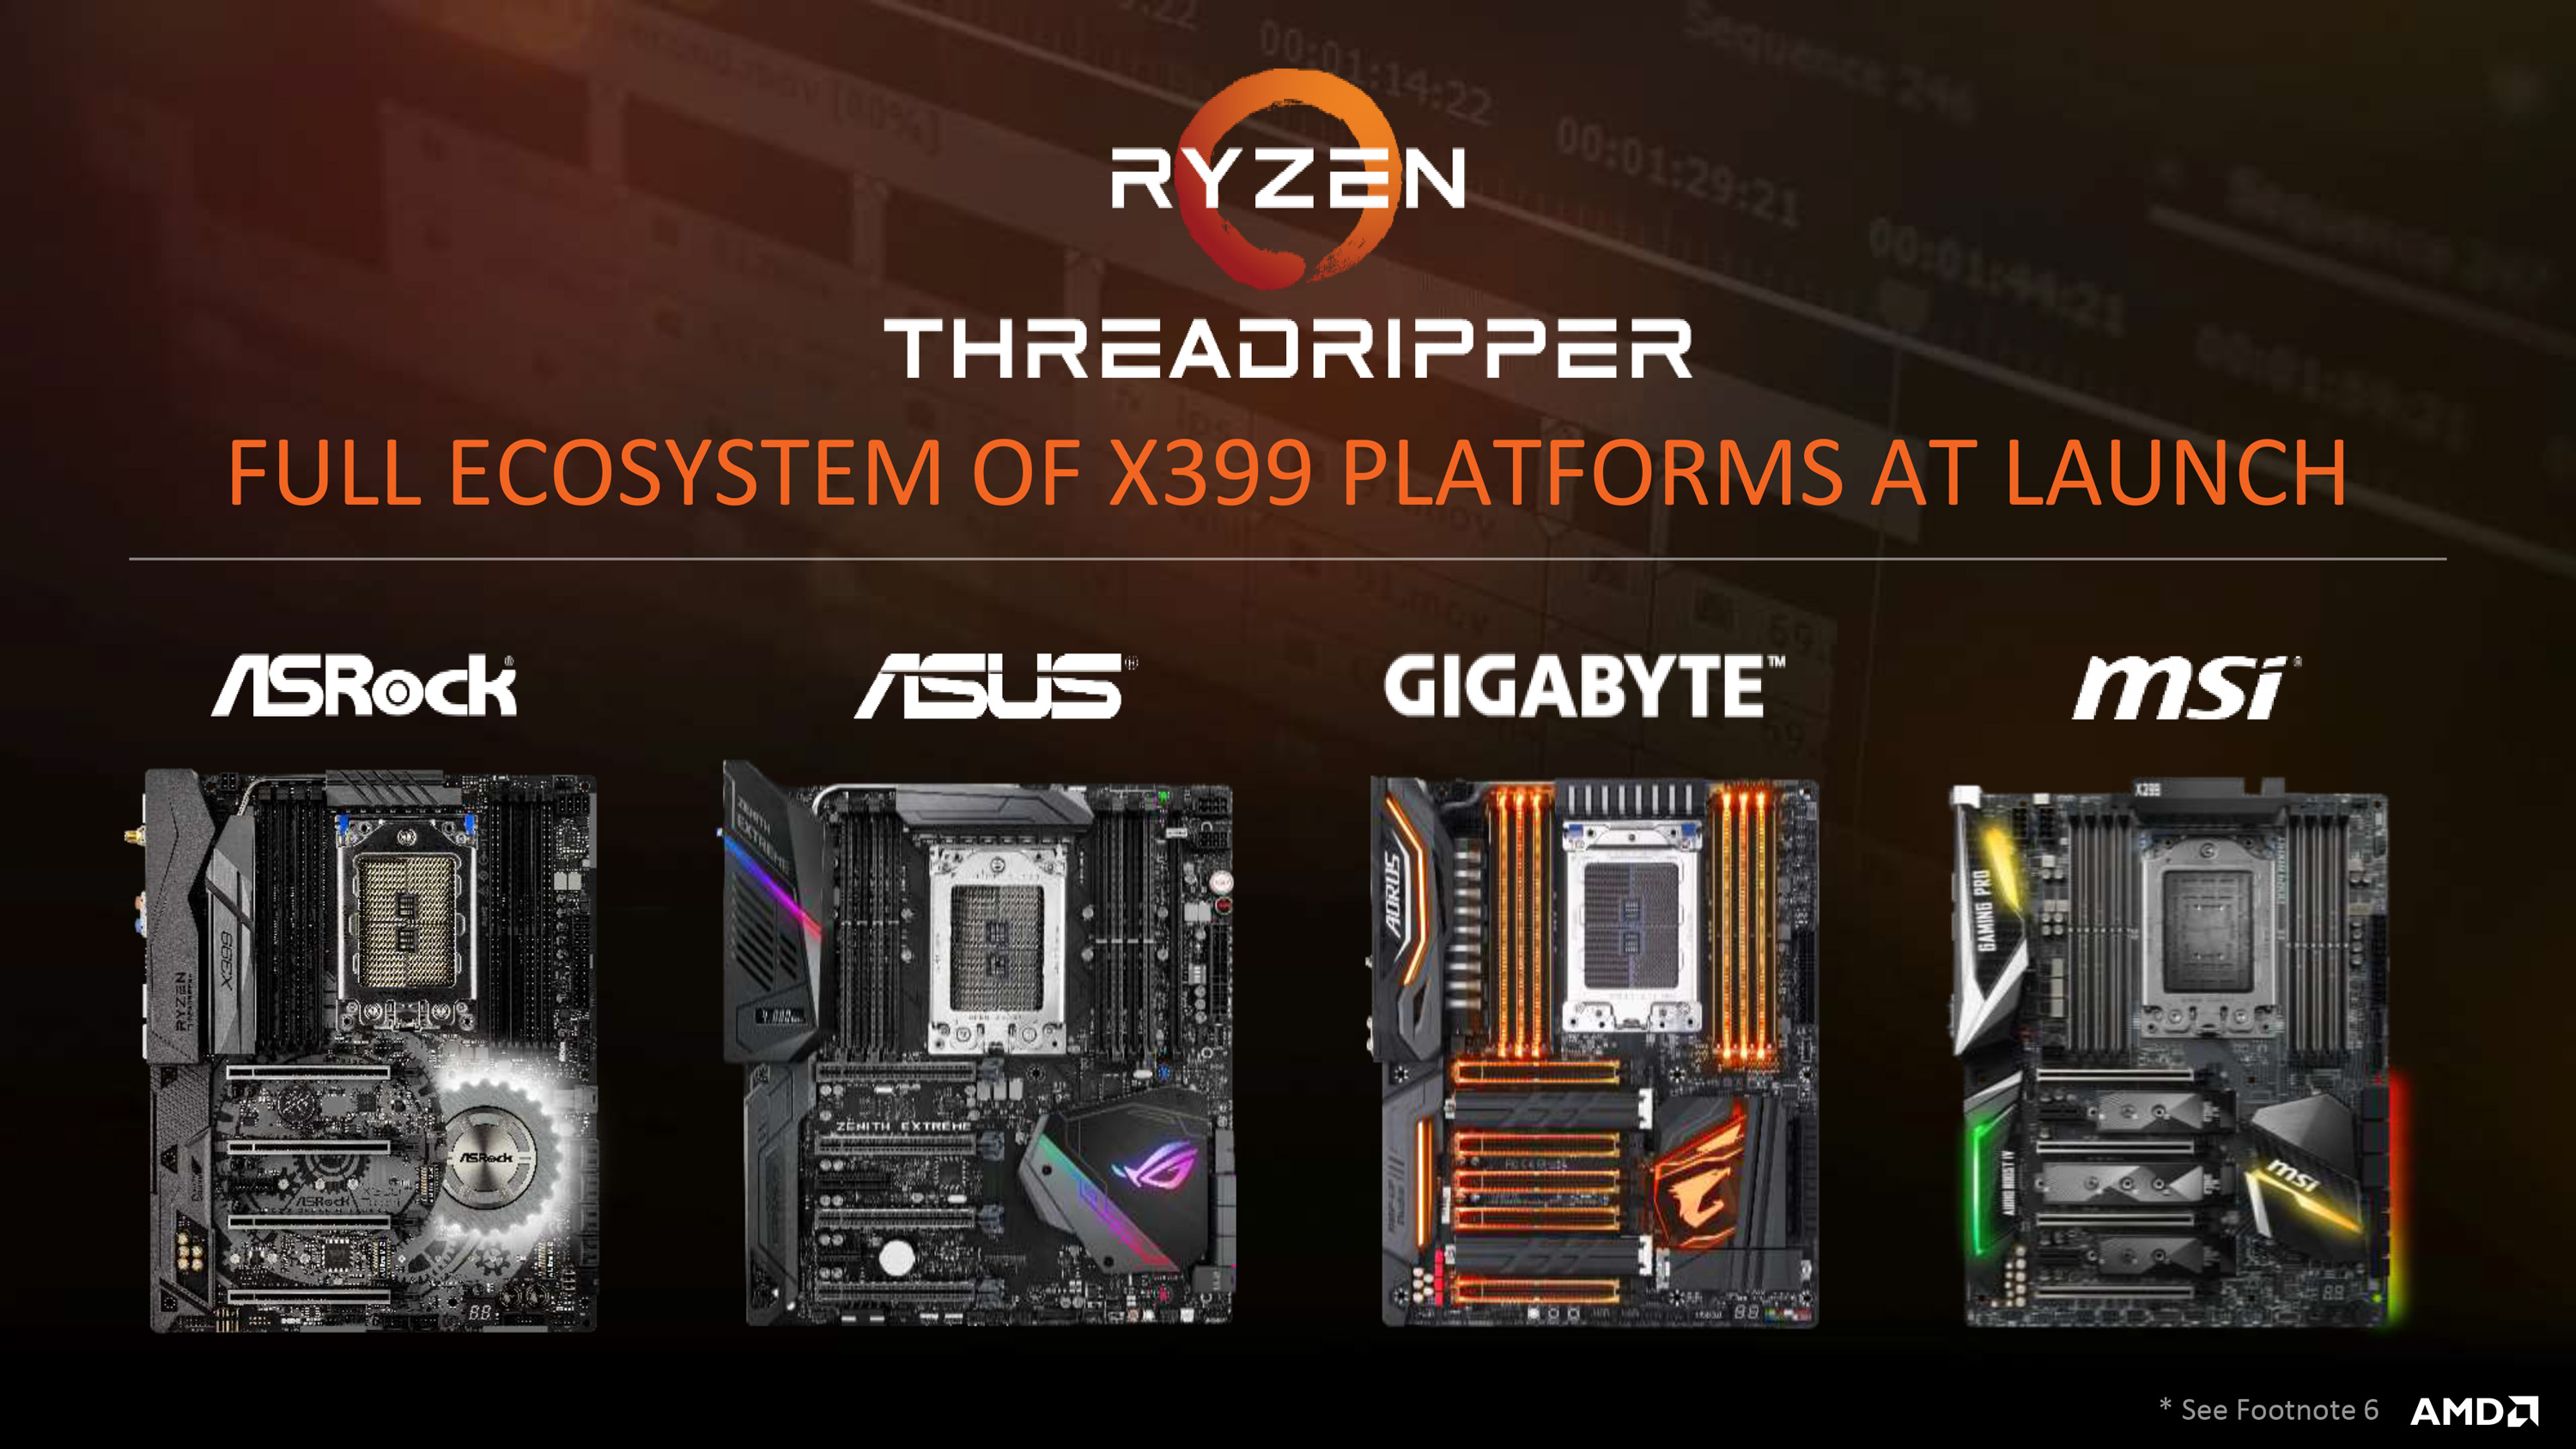
A total of six motherboards from the four main manufacturers should be available on day one, with at least one or two more coming down the pipe. Our own Joe Shields has written an extensive preview of each motherboard to accompany this article.
The crux of the motherboard design will be down to how each of the available IO functions is routed. AMD’s base block diagram is as follows:
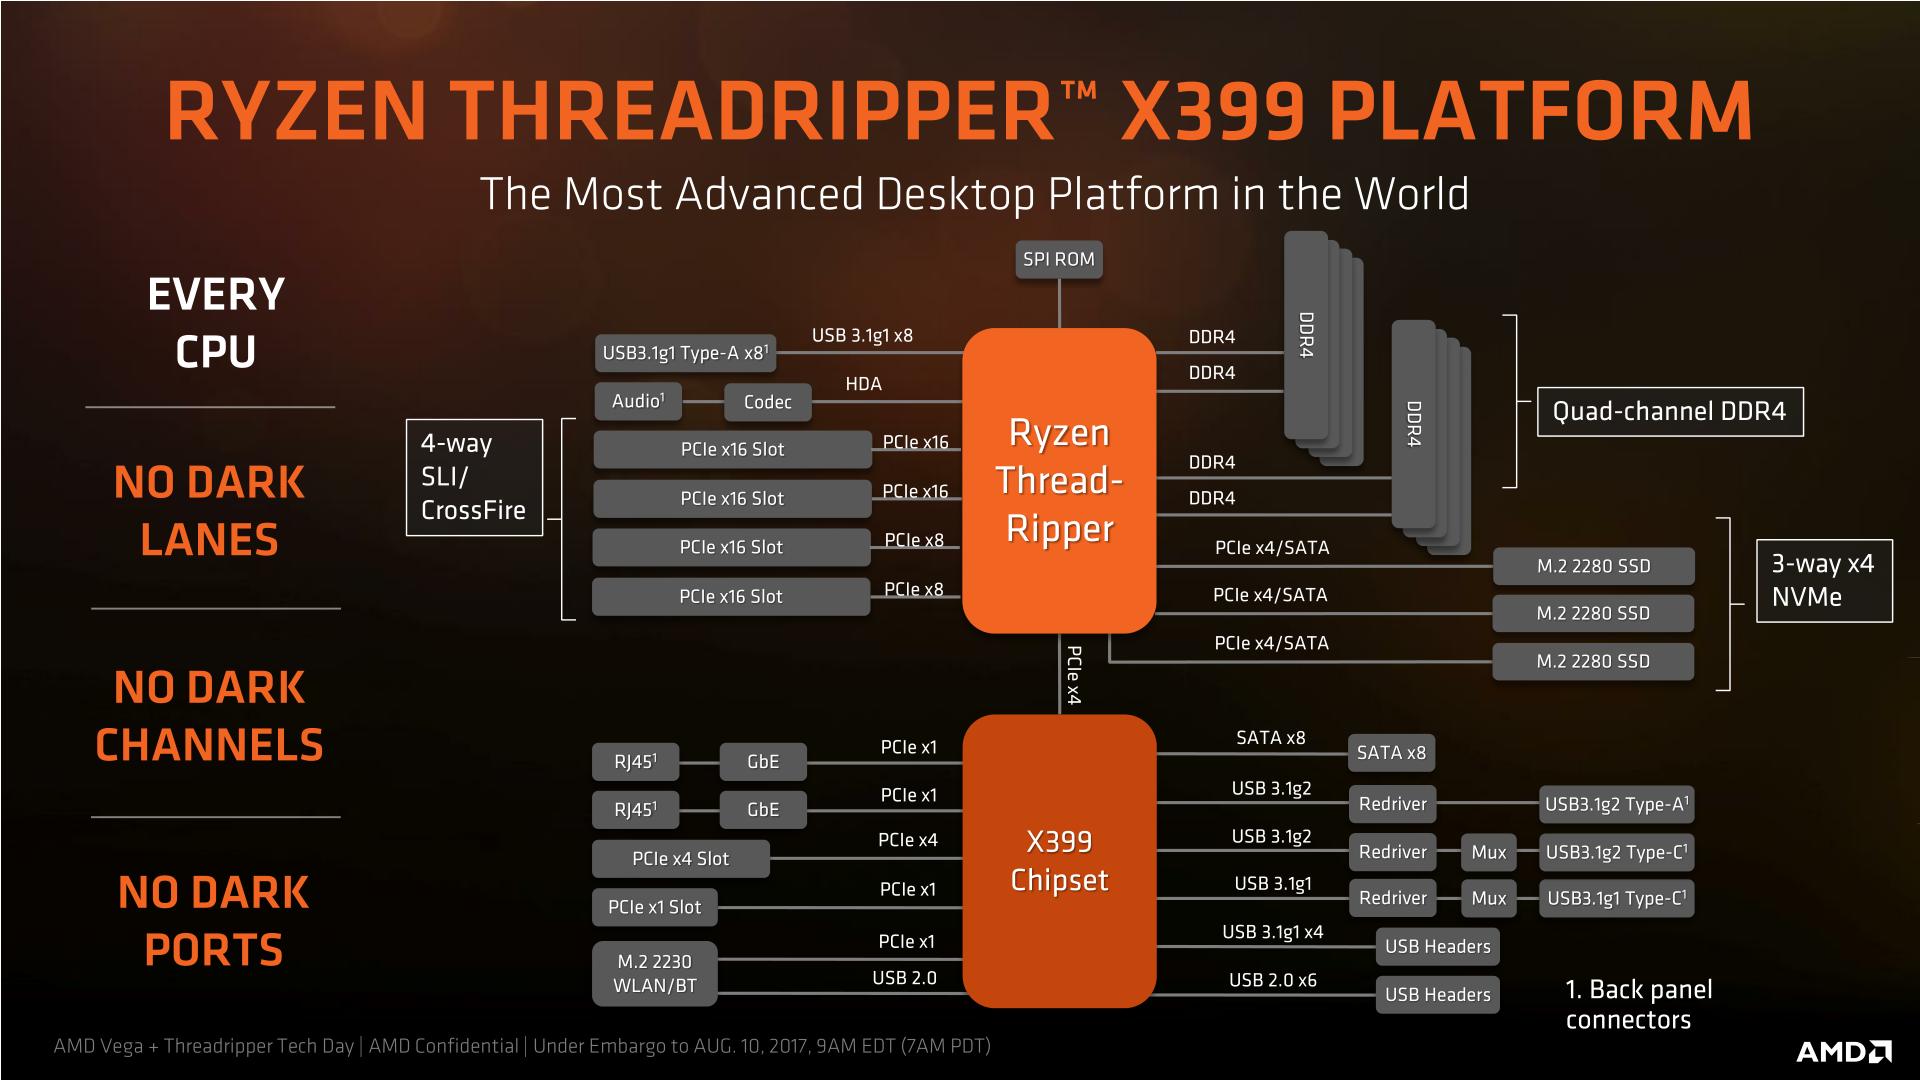
AMD's suggested configuration gives 48 lanes from the CPU to the PCIe slots for 4-way SLI/CFX action (16/16/8/8), 12 lanes from the CPU to M.2 slots for 3-way x4 NVMe, and 4 lanes to the chipset. The chipset then would have two gigabit Ethernet ports, a PCIe x4 slot, a PCIe x1 slot, a PCIe x1 for WiFi, SATA ports, USB 3.1 Gen 1 and USB 3.1 Gen 2, and USB 2.0 ports.
At present we expect the X399 motherboards to vary between $249 and $599, depending on their feature set. The motherboard we were sampled for the launch review was ASUS’ X399 ROG Zenith Extreme, which has an MSRP of $549.
Competition
We asked both Intel and AMD to list what they consider would be the ideal competition for the Threadripper processors. Given that Threadripper is a consumer focused product – and interestingly, not really a workstation focused product – AMD expectantly stated that Intel’s current Core i9-7900X, a 10-core processor, is the product available today that best fits that role. A Xeon would be an workstation/enterprise product, which would not be sold in many prebuilt systems that Threadripper customers might want.
Intel surprised me, in saying exactly the same thing. They stated that the Core i9-7900X would be the best fit at the time of Threadripper’s launch. I half-expected them to suggest some form of cheaper 2P option, although when I followed them up as to why they didn’t suggest such a thing, it became obvious for two reasons: firstly, Intel’s Consumer and Intel’s Enterprise divisions are almost different companies with little crossover or insight into the other’s business. There are no unified press relations on this front: ask the consumer team, get the consumer answer. Ask the Enterprise team and they’re more focused on EPYC, not Threadripper. The second reason is that a ‘cheap 2P’ system doesn’t exist when you buy new – most online discussions about cheaper Intel 2P systems revolve around finding CPU bargains from the gray market or resellers.
So the competition is essentially Skylake-X (and a nod to Broadwell-E at a discount). The AMD Threadripper 1950X with 16-cores and 1920X with 12-cores are put up against the Core i9-7900X with 10-cores and the Core i7-7820X with 8 cores. Broadwell’s Core i7-6950X also makes an appearance due to the different microarchitecture. We’ll add in AMD’s Ryzen 7 1800X as a contender as well, and Ryzen 7 1700 as a performance per dollar competitor.
| The Battle | |||||||||
| Cores/ Threads |
Base/ Turbo |
XFR | L3 | DRAM 1DPC |
PCIe | TDP | Cost (8/10) |
||
| AMD | TR 1950X | 16/32 | 3.4/4.0 | +200 | 32 MB | 4x2666 | 60 | 180W | $999 |
| Intel | i9-7900X | 10/20 | 3.3/4.3 | +200 | 13.75 | 4x2666 | 44 | 140W | $980 |
| Intel | i7-6950X | 10/20 | 3.0/3.5 | +500 | 25 MB | 4x2400 | 40 | 140W | $1499 |
| AMD | TR 1920X | 12/24 | 3.5/4.0 | +200 | 32 MB | 4x2666 | 60 | 180W | $799 |
| Intel | i7-7820X | 8/16 | 3.6/4.3 | +200 | 11 MB | 4x2666 | 28 | 140W | $593 |
| AMD | TR 1900X | 8/16 | 3.8/4.0 | +200 | 16 MB | 4x2666 | 60 | 180W | $549 |
| AMD | R7 1800X | 8/16 | 3.6/4.0 | +100 | 16 MB | 2x2666 | 16 | 95 W | $419 |
| AMD | R7 1700X | 8/16 | 3.4/3.8 | +100 | 16 MB | 2x2666 | 16 | 95 W | $350 |
| AMD | R7 1700 | 8/16 | 3.0/3.7 | +50 | 16 MB | 2x2666 | 16 | 65 W | $291 |
The key here is that Threadripper has more cores and more PCIe lanes at the same price, with a lower turbo but a higher base frequency, at slightly more power for similar platform costs. It’s going to be an interesting battle.
Pages In This Review
- 1: AMD Ryzen Threadripper 1950X and 1920X
- 2: Feeding the Beast and CPU Top Trumps
- 3: Silicon, Glue, & NUMA Too
- 4: AMD’s Solution to Dual Dies: Creator Mode and Game Mode
- 5: Test Bed and Setup
- 6: Benchmark Overview
- 7: Benchmarking Performance: CPU System Tests
- 8: Benchmarking Performance: CPU Rendering Tests
- 9: Benchmarking Performance: CPU Web Tests
- 10: Benchmarking Performance: CPU Encoding Tests
- 11: Benchmarking Performance: CPU Office Tests
- 12: Benchmarking Performance: CPU Legacy Tests
- 13: Gaming Performance: Civilization 6 (1080p, 4K, 8K, 16K)
- 14: Gaming Performance: Ashes of the Singularity Escalation (1080p, 4K)
- 15: Gaming Performance: Shadow of Mordor (1080p, 4K)
- 16: Gaming Performance: Rise of the Tomb Raider (1080p, 4K)
- 17: Gaming Performance: Rocket League (1080p, 4K)
- 18: Gaming Performance: Grand Theft Auto V (1080p, 4K)
- 19: Power Consumption and Efficiency
- 20: Analyzing Creator Mode and Game Mode
- 21: Conclusions and Final Words
Additional Review Notes
Due to circumstances beyond our control, this review has no Skylake-X gaming data. At the time of our SKL-X review, it was throwing up some issues and so we aimed to test at a later date. We ran some more data using the latest BIOS and a more stringent cooling setup, then when Threadripper arrived we packed the SKL-X away and Threadripper took the phsyical place of SKL-X in the lab. Having had time to look back at our SKL-X results and now process them, we had one CPU+GPU combo that seemed to perform as expected but the rest were still erroneous. Once this review is out of the way and a couple of mini-projects, we're going to update the X299 motherboard with a new one and knuckle down to find this issue, as it appears to be BIOS/firmware related.
Feeding the Beast
When frequency was all that mattered for CPUs, the main problem became efficiency, thermal performance, and yields: the higher the frequency was pushed, the more voltage needed, the further outside the peak efficiency window the CPU was, and the more power it consumed per unit work. For the CPU that was to sit at the top of the product stack as the performance halo part, it didn’t particularly matter – until the chip hit 90C+ on a regular basis.
Now with the Core Wars, the challenges are different. When there was only one core, making data available to that core through caches and DRAM was a relatively easy task. With 6, 8, 10, 12 and 16 cores, a major bottleneck suddenly becomes the ability to make sure each core has enough data to work continuously, rather than waiting at idle for data to get through. This is not an easy task: each processor now needs a fast way of communicating to each other core, and to the main memory. This is known within the industry as feeding the beast.
Top Trumps: 60 PCIe Lanes vs 44 PCIe lanes
After playing the underdog for so long, AMD has been pushing the specifications of its new processors as one of the big selling points (among others). Whereas Ryzen 7 only had 16 PCIe lanes, competing in part against CPUs from Intel that had 28/44 PCIe lanes, Threadripper will have access to 60 lanes for PCIe add-in cards. In some places this might be referred to as 64 lanes, however four of those lanes are reserved for the X399 chipset. At $799 and $999, this competes against the 44 PCIe lanes on Intel’s Core i9-7900X at $999.
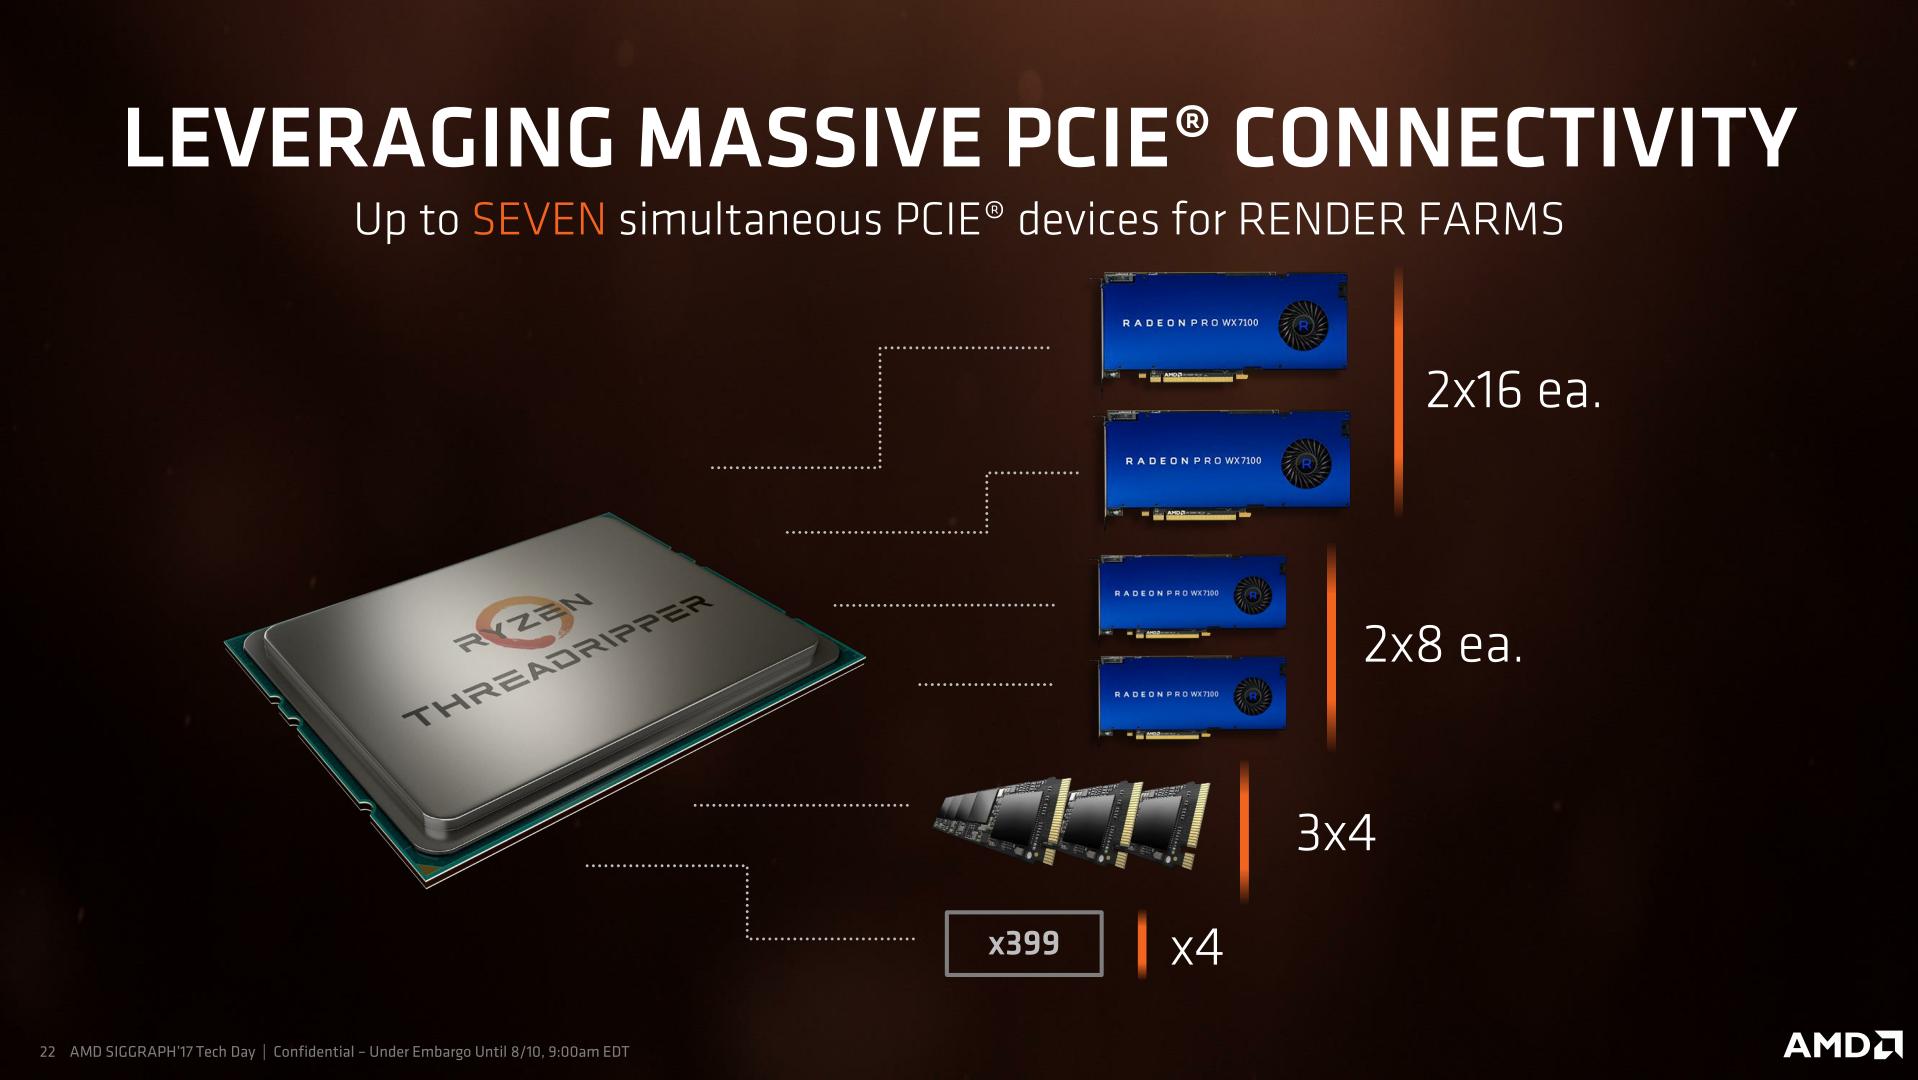
The goal of having so many PCIe lanes is to support the sort of market these processors are addressing: high-performance prosumers. These are users that run multiple GPUs, multiple PCIe storage devices, need high-end networking, high-end storage, and as many other features as you can fit through PCIe. The end result is that we are likely to see motherboards earmark 32 or 48 of these lanes for PCIe slots (x16/x16, x8/x8/x8/x8, x16/x16/x16, x16/x8/x16/x8), followed by a two or three for PCIe 3.0 x4 storage via U.2 drives or M.2 drives, then faster Ethernet (5 Gbit, 10 Gbit). AMD allows each of the PCIe root complexes on the CPU, which are x16 each, to be bifurcated down to x1 as needed, for a maximum of 7 devices. The 4 PCIe lanes going to the chipset will also support several PCIe 3.0 and PCIe 2.0 lanes for SATA or USB controllers.
Intel’s strategy is different, allowing 44 lanes into x16/x16/x8 (40 lanes) or x16/x8/x16/x8 (40 lanes) or x16/x16 to x8/x8/x8x8 (32 lanes) with 4-12 lanes left over for PCIe storage or faster Ethernet controllers or Thunderbolt 3. The Skylake-X chipset then has an additional 24 PCIe lanes for SATA controllers, gigabit Ethernet controllers, SATA controllers and USB controllers.
Top Trumps: DRAM and ECC
One of Intel’s common product segmentations is that if a customer wants a high core count processor with ECC memory, they have to buy a Xeon. Typically Xeons will support a fixed memory speed depending on the number of channels populated (1 DIMM per channel at DDR4-2666, 2 DIMMs per channel at DDR4-2400), as well as ECC and RDIMM technologies. However, the consumer HEDT platforms for Broadwell-E and Skylake-X will not support these and use UDIMM Non-ECC only.
AMD is supporting ECC on their Threadripper processors, giving customers sixteen cores with ECC. However, these have to be UDIMMs only, but do support DRAM overclocking in order to boost the speed of the internal Infinity Fabric. AMD has officially stated that the Threadripper CPUs can support up to 1 TB of DRAM, although on close inspection it requires 128GB UDIMMs, which max out at 16GB currently. Intel currently lists a 128GB limit for Skylake-X, based on 16GB UDIMMs.
Both processors run quad-channel memory at DDR4-2666 (1DPC) and DDR4-2400 (2DPC).
Top Trumps: Cache
Both AMD and Intel use private L2 caches for each core, then have a victim L3 cache before leading to main memory. A victim cache is a cache that obtains data when it is evicted from the cache underneath it, and cannot pre-fetch data. But the size of those caches and how AMD/Intel has the cores interact with them is different.
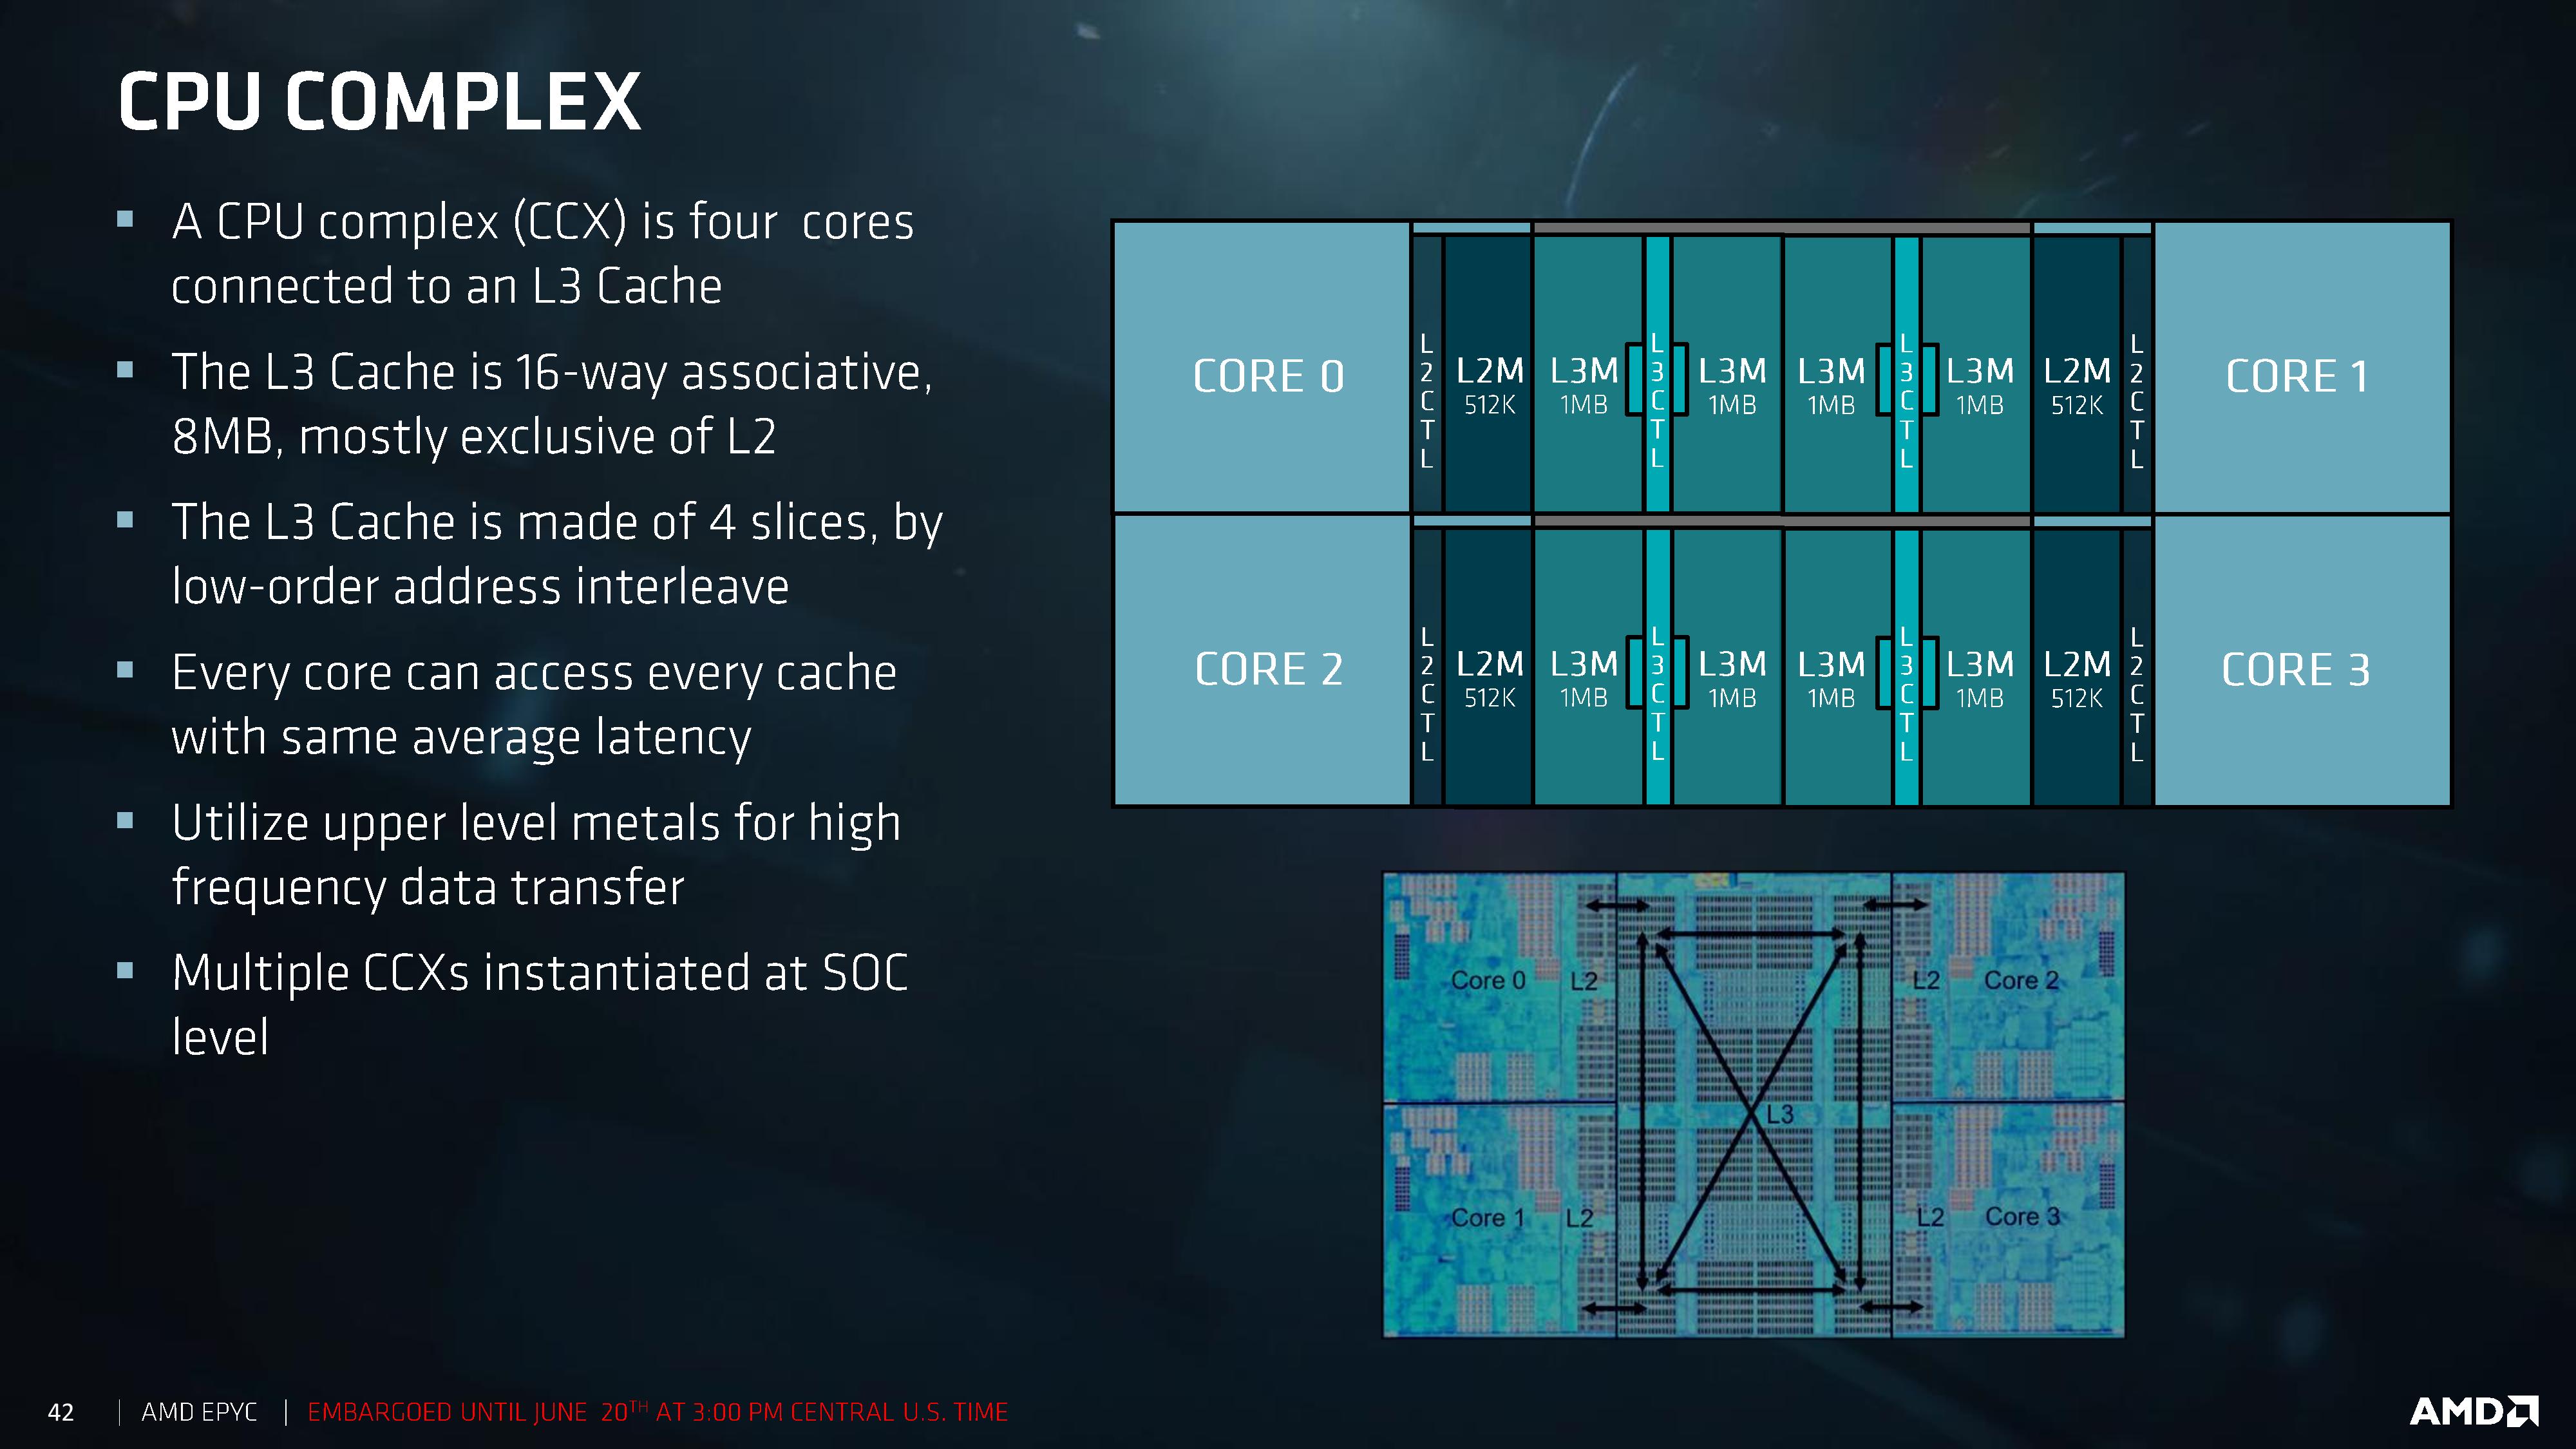
AMD uses 512 KB of L2 cache per core, leading to an 8 MB of L3 victim cache per core complex of four cores. In a 16-core Threadripper, there are four core complexes, leading to a total of 32 MB of L3 cache, however each core can only access the data found in its local L3. In order to access the L3 of a different complex, this requires additional time and snooping. As a result there can be different latencies based on where the data is in other L3 caches compared to a local cache.
Intel’s Skylake-X uses 1MB of L2 cache per core, leading to a higher hit-rate in the L2, and uses 1.375MB of L3 victim cache per core. This L3 cache has associated tags and the mesh topology used to communicate between the cores means that like AMD there is still time and latency associated with snooping other caches, however the latency is somewhat homogenized by the design. Nonetheless, this is different to the Broadwell-E cache structure, that had 256 KB of L2 and 2.5 MB of L3 per core, both inclusive caches.
Silicon, Glue, & NUMA Too
In the Ryzen family, AMD designed an 8 core silicon die known as a Zeppelin die. This consisted of two core complexes (CCX) of four cores each, with each CCX having access to 8 MB of L3 cache. The Zeppelin die had access to two DRAM channels, and was fixed with 16 PCIe lanes for add-in cards. With Threadripper, AMD has doubled up the silicon.
If you were to delid a Threadripper CPU, you would actually see four silicon dies, similar to what an EPYC processor would have, making Threadripper a Multi Core Module (MCM) design. Two of these are reinforcing spacers – empty silicon with no use other than to help distribute the weight of the cooler and assist in cooling. The other two dies (in opposite corners for thermal performance and routing) are basically the same Zeppelin dies as Ryzen, containing eight cores each and having access to two memory channels each. They communicate through Infinity Fabric, which AMD lists as 102 GB/s die-to-die bandwidth (full duplex bidirectional), along with 78ns to reach the near memory (DRAM connected to the same die) and 133ns to reach the far memory (DRAM on another die). We confirmed those numbers on DDR4-2400 memory, also achieving 65 ns and 108 ns respectively using DDR4-3200.
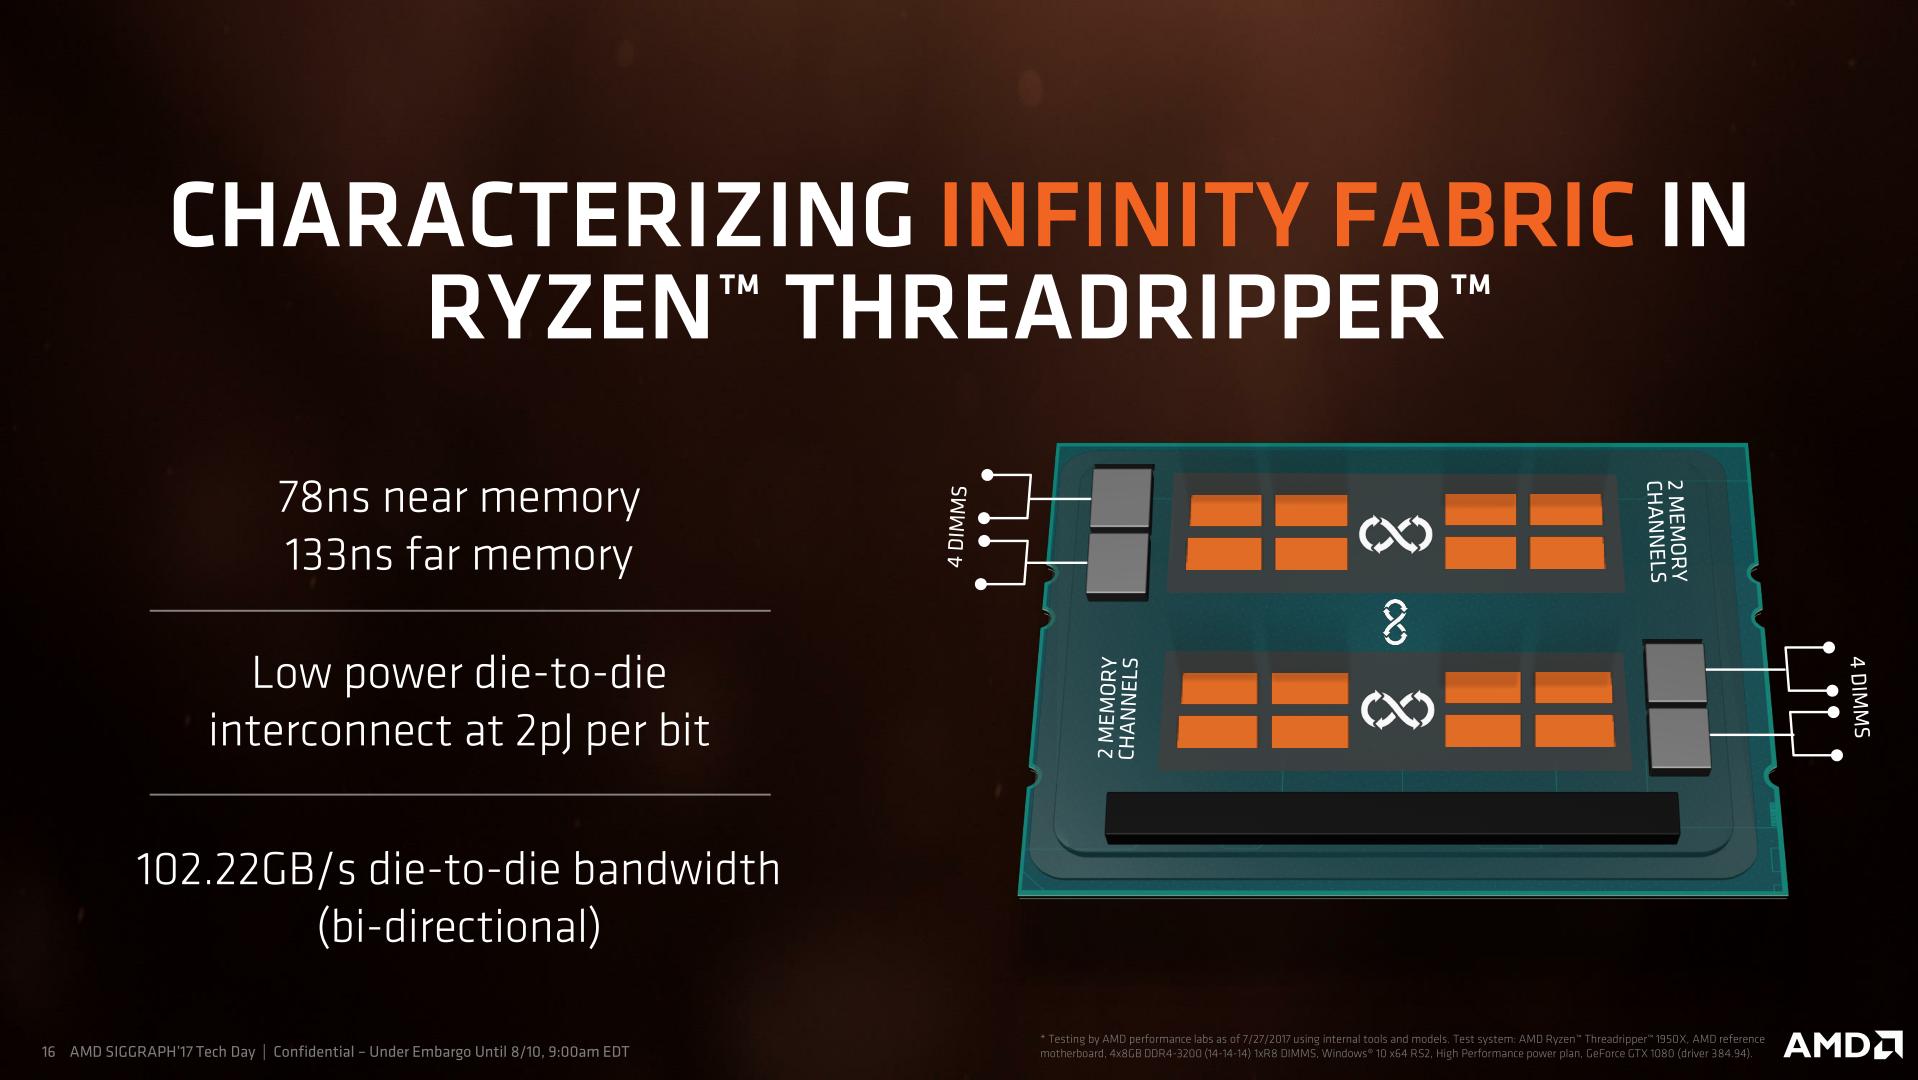
Despite this AMD slide showing two silicon dies, there are four units of silicon in the package. Only two of the dies are active, so AMD has 'simplified' the diagram'
By comparison, EPYC lists die-to-die bandwidth as 42.6 GB/s at DDR4-2666. This is because EPYC runs fabric links to three dies internally and one die externally (on the next socket), which maximizes all the links available. The dies in Threadripper only have to communicate with one other die, so has more flexibility. To that extent, we’re under the impression that Threadripper is using two of these links at 10.4 GT/s using the following method:
- Die to Die for EPYC is quoted as 42.6 GB/s at DDR4-2667
- Die to Die for Threadripper is quoted as 102.2 GB/s at DDR4-3200
- 42.6 GB/s * 2 links * 3200/2667 = 102.2 GB/s
- 42.6 GB/s * 3 links * 3200/2667 at 8.0 GT/s = 115.8 GB/s (too high)
- 42.6 GB/s * 3 links * 3200/2667 at 6.4 GT/s = 92.6 GB/s (too low)
This configuration for AMD is essentially what the industry calls a NUMA configuration: non-uniform memory access. If left as it, it means that code cannot rely on a regular (and low) latency between requesting something from DRAM and receiving it. This can be an issue for high-performance code, which is why some software is designed NUMA-aware, so that it can intelligently pin the memory it needs to the closest DRAM controller, lowering potential bandwidth but prioritizing latency.
NUMA is nothing new in the x86 space. Once CPUs began shipping with on-die memory controllers rather than using an off-die memory controller in the Northbridge, NUMA became an inherent part of multi-socket systems. In this respect AMD was the leader here right from the start, as they beat Intel to on-die memory controllers for x86 CPUs by years. So AMD has been working with NUMA for years, and similarly NUMA has been the state of affairs for Intel's multi-socket server systems for almost a decade.
What's new with Threadripper however is that NUMA has never been a consumer concern. MCM consumer CPUs have been few and far between, and we'd have to go all the way back to the Core 2 Quad family to find a CPU with cores on multiple dies, which was a design that predates on-die memory controllers for Intel. So with Threadripper, this is the very first time that consumers – even high-end consumers – have been exposed to NUMA.
But more importantly, consumer software has been similarly unexposed to NUMA, so almost no software is able to take its idiosyncrasies into account. The good news is that while NUMA changes the rules of the game a bit, it doesn't break software. NUMA-aware OSes do the heavy lifting here, helping unaware software by keeping threads and memory accesses together on the same NUMA node in order to ensure classic performance characteristics. The downside to this is that much like an overprotective parent, the OS is going discourage unaware software from using other NUMA nodes. Or in the case of Threadripper, discouraging applications from using the other die and its 8 cores.
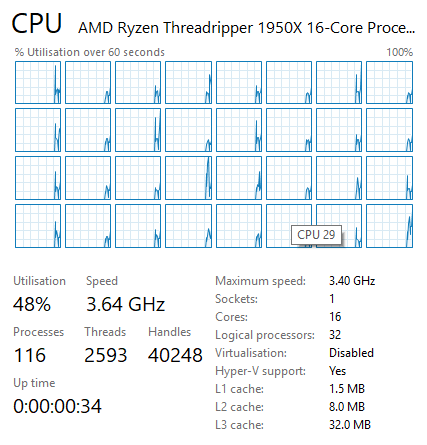
At a hardware level, Threadripper is natively two NUMA nodes
In an ideal world, all software would be NUMA-aware, eliminating any concerns over the matter. From a practical perspective however, software is slow to change and it seems unlikely that NUMA-style CPUs are going to become common in the future. Furthermore NUMA can be tricky to program for, especially in the case of workloads/algorithms that inherently struggle with "far" cores and memory. So the quirks of NUMA are never going to completely go away, and instead AMD has taken it upon themselves to manage the matter.
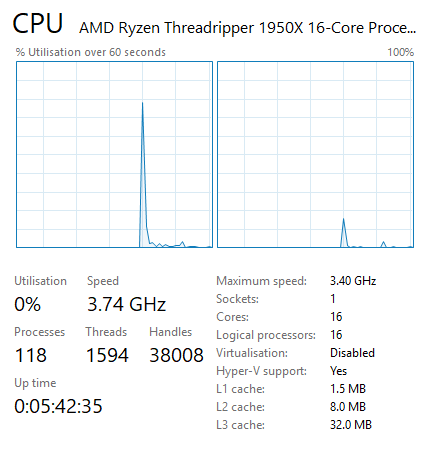
AMD has implemented BIOS switches and software switches in order to better support and control the NUMAness of Threadripper. By default, Threadripper actually hides its NUMA architecture. AMD instead runs Threadripper in a UMA configuration: a uniform memory access system where memory is sent to any DRAM and the return is variable in latency (e.g. ~100ns averaging between 78ns and 133ns) but focusing for a high peak bandwidth. By presenting the CPU to the OS as a monolithic, single-domain design, memory bandwidth is maximized and all applications (NUMA-aware and not) see all 16 cores as part of the same CPU. So for applications that are not NUMA-aware – and consequently would have been discouraged by the OS in NUMA mode – this maximizes the number of cores/threads they can use and the memory bandwidth they can use.
All 32 threads are exposed as part of a single monolithic CPU
The drawback to UMA mode is that because it's hiding how Threadripper really works, it doesn't allow the OS and applications to make fully informed decisions for themselves, and consequently they may not make the best decisions. Latency-sensitive NUMA-unaware applications that fare poorly with high core/memory latencies can struggle here if they use cores and memory attached to the other die. Which is why AMD also allows Threadripper to be configured for NUMA mode, exposing its full design to the OS and resulting in separate NUMA domains for the two dies. This informs the OS to keep applications pinned to one die when possible as previously discussed, and this mode is vital for some software and some games, and we’ve tested it in this review.
Overall, using a multi-silicon design has positives and negatives. The negatives end up being variable memory latency, variable core-to-core latency, and often redundancy in on-die units that don’t need to be repeated. As a result, AMD uses 400mm2+ of silicon to achieve this, which can increase costs at the manufacturing level. By contrast, the positives are in silicon design and overall yeilds: being able to design a single piece of silicon and repeat it, rather than design several different floor plans which multiplies up the design costs, and having the (largely) fixed number of wafer defects spread out over many more smaller dies.
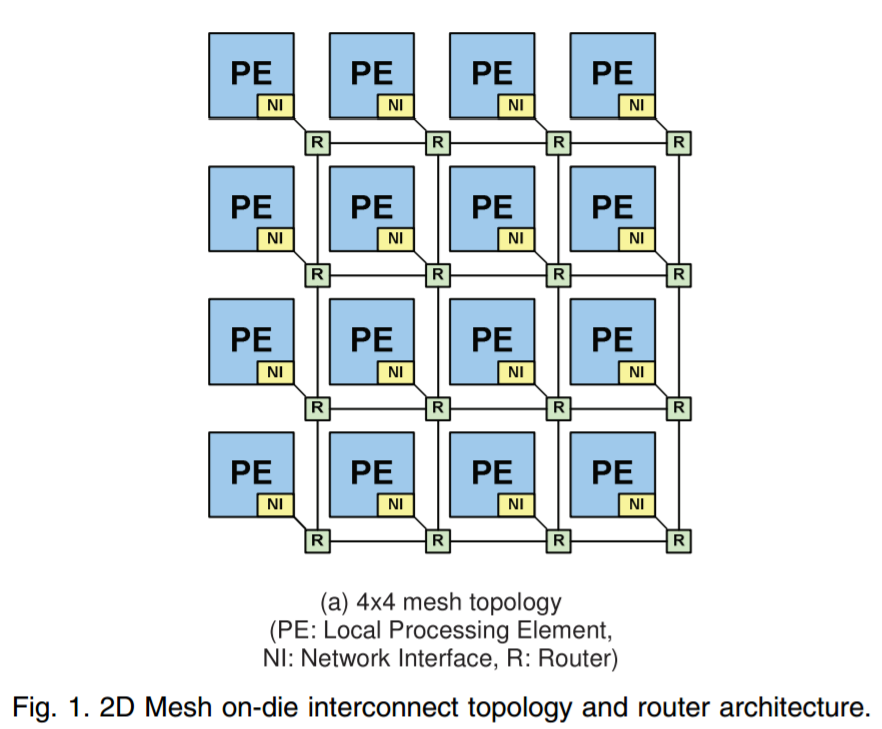
By contrast, Intel uses a single monolithic die for its Skylake-X processors: the LCC die up to 10-core and HCC die from 12-core up to 18-core. These use a rectangular grid of cores (3x4 and 5x4 respectively), with two of the segments reserved for the memory controllers. In order to communicate between the cores, Intel uses a networking mesh, which determines which direction the data needs to travel (up, down, left, right, or accepted into the core). We covered Intel’s MOdular Decoupled Crossbar (MoDe-X) methodology in our Skylake-X review, but the underlying concept is consistency. This mesh runs at 2.4 GHz nominally. Prior to Skylake-X, Intel implemented a ring topology, such that data would have to travel around the ring of cores to get to where it needed to go.
With reference to glue, or glue-logic, we’re referring to the fabric of each processor. For AMD that’s the Infinity Fabric, which has to travel within the silicon die or out to the other silicon die, and for Intel that’s the internal MoDe-X mesh. Elmer’s never looked so complicated.
Creator Mode and Game Mode
*This page was updated on 8/17. A subsequent article with new information has been posted.
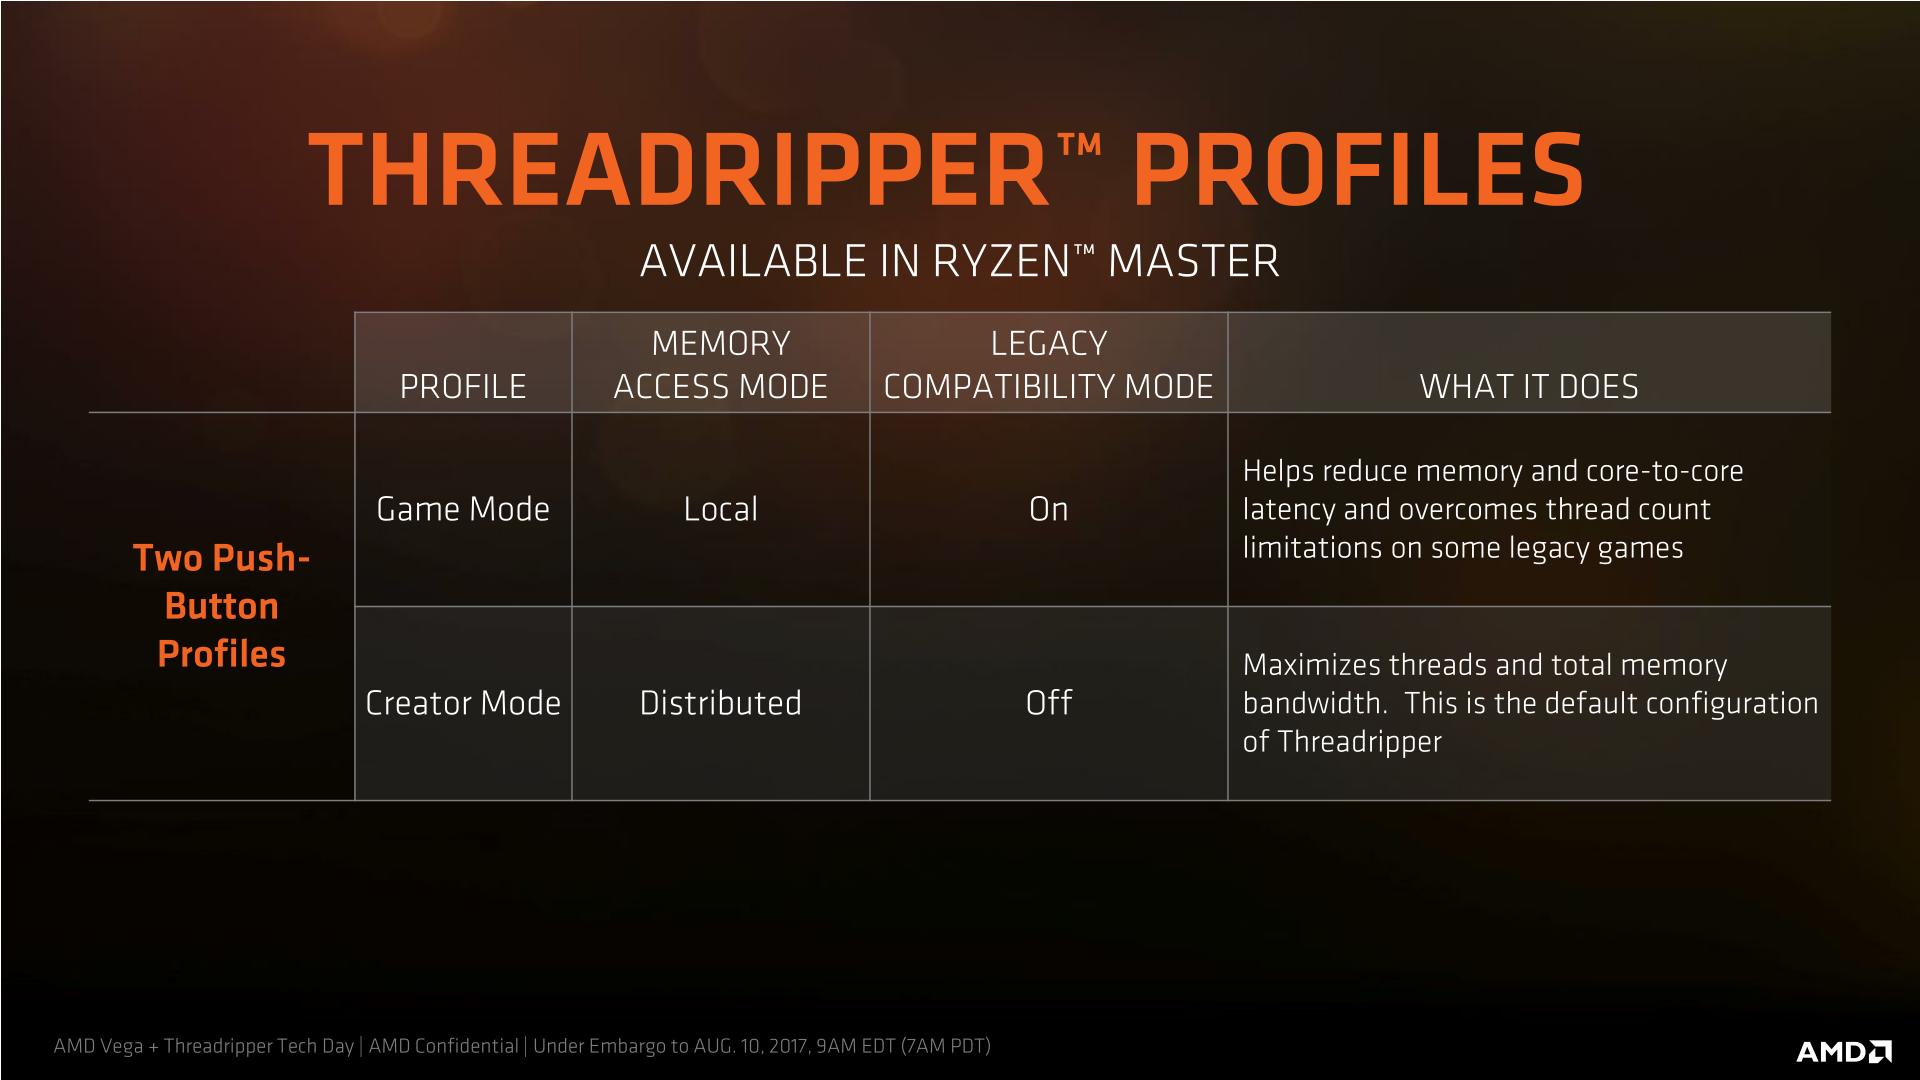
Due to the difference in memory latency between the two pairs of memory channels, AMD is implementing a ‘mode’ strategy for users to select depending on their workflow. The two modes are called Creator Mode (default), and Game Mode, and control two switches in order to adjust the performance of the system.
The two switches are:
- Legacy Compatibility Mode, on or off (off by default)
- Memory Mode: UMA vs NUMA (UMA by default)
The first switch disables the cores in one fo the silicon dies, but retains access to the DRAM channels and PCIe lanes. When the LCM switch is off, each core can handle two threads and the 16-core chip now has a total of 32 threads. When enabled, the system cuts half the cores, leaving 8 cores and 16 threads. This switch is primarily for compatibility purposes, as certain games (like DiRT) cannot work with more than 20 threads in a system. By reducing the total number of threads, these programs will be able to run. Turning the cores in one die off also alleviates some potential pressure in the core microarchitecture for cross communication.
The second switch, Memory Mode, puts the system into a unified memory architecture (UMA) or a non-unified memory architecture (NUMA) mode. Under the default setting, unified, the memory and CPU cores are seen as one massive block to the system, with maximum bandwidth and an average latency between the two. This makes it simple for code to understand, although the actual latency for a single instruction will be a good +20% faster or slower than the average, depending on which memory bank it is coming from.

NUMA still gives the system the full memory, but splits the memory and cores into into two NUMA banks depending on which pair of memory channels is nearest the core that needs the memory. The system will keep the data for a core as near to it as possible, giving the lowest latency. For a single core, that means it will fill up the memory nearest to it first at half the total bandwidth but a low latency, then the other half of the memory at the same half bandwidth at a higher latency. This mode is designed for latency sensitive workloads that rely on the lower latency removing a bottleneck in the workflow. For some code this matters, as well as some games – low latency can affect averages or 99th percentiles for game benchmarks.
The confusing thing about this switch is that AMD is calling it ‘Memory Access Mode’ in their documents, and labeling the two options as Local and Distributed. This is easier to understand than the SMT switch, in that the Local setting focuses on the latency local to the core (NUMA), and the Distributed setting focuses on the bandwidth to the core (UMA), with Distributed being default.
- When Memory Access Mode is Local, NUMA is enabled (Latency)
- When Memory Access Mode is Distributed, UMA is enabled (Bandwidth, default)
So with that in mind, there are four ways to arrange these two switches. AMD has given two of these configurations specific names to help users depending on how they use their system: Creator Mode is designed to give as many threads as possible and as much memory bandwidth as possible. Game Mode is designed to optimize for latency and compatibility, to drive game frame rates.
| AMD Threadripper Options | |||||
| Words That Make Sense | Marketing Spiel | ||||
| Ryzen Master Profile |
Two Dies or One Die |
Memory Mode |
Legacy Compatibility Mode |
Memory Access Mode |
|
| Creator Mode | Two | UMA | Off | Distributed | |
| - | Two | NUMA | Off | Local | |
| - | One | UMA | On | Distributed | |
| Game Mode | One | NUMA | On | Local | |
There are two ways to select these modes, although this is also a confusing element to this situation.
The way I would normally adjust these settings is through the BIOS, however the BIOS settings do not explicitly state ‘Creator Mode’ and ‘Game Mode’. They should give immediate access for the Memory Mode, where ASUS has used the Memory Access naming for Local and Distributed, not NUMA and UMA. For the Legacy Compatibility Mode, users will have to dive several screens down into the Zen options and manually switch off eight of the cores, if the setting is going to end up being visible to the user. This makes Ryzen Master the easiest way to implement Game Mode.
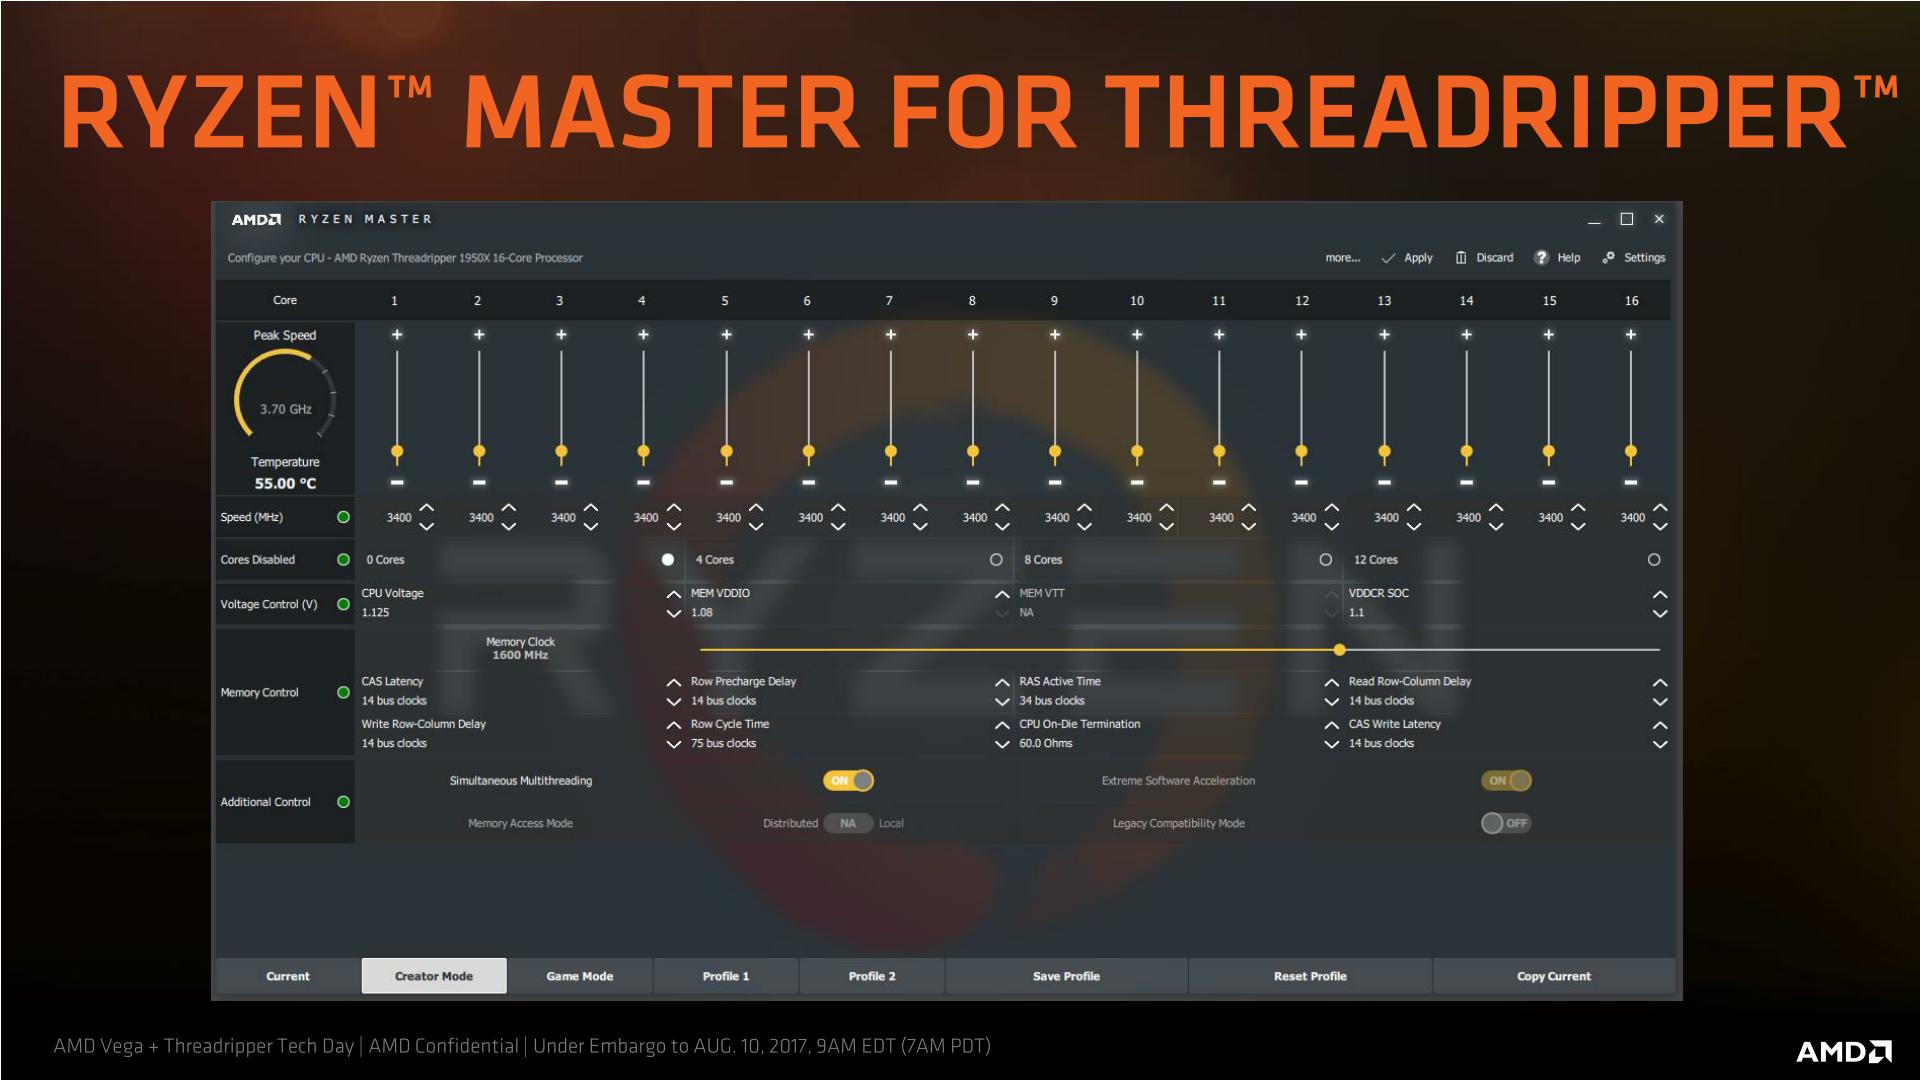
While we were testing Threadripper, AMD updated Ryzen Master several times to account for the latest updates, so chances are that by the time you are reading this, things might have changed again. But the crux is that Creator Mode and Game Mode are not separate settings here either. Instead, AMD is labelling these as ‘profiles’. Users can select the Creator Mode profile or the Game Mode profile, and within those profiles, the two switches mentioned above (labelled as Legacy Compatibility Mode and Memory Access Mode) will be switched as required.
Cache Performance
As an academic exercise, Creator Mode and Game Mode make sense depending on the workflow. If you don’t need the threads and want the latency bump, Game Mode is for you. The perhaps odd thing about this is that Threadripper is aimed at highly threaded workloads more than gaming, and so losing half the threads in Game Mode might actually be a detriment to a workstation implementation. That being said, users can leave SMT on and still change the memory access mode on its own, although AMD is really focusing more on the Creator and Game mode specifically.
For this review, we tested both Creator (default) and Game modes on the 16-core Threadripper 1950X. As an academic exercise we looked into memory latency in both modes, as well as at higher DRAM frequencies. These latency numbers take the results for the core selected (we chose core 2 in each case) and then stride through to hit L1, L2, L3 and main memory. For UMA systems like in Creator Mode, main memory will be an average between the near and far memory results. We’ve also added in here a Ryzen 5 1600X as an example of a single Zeppelin die, and a 6950X Broadwell for comparison. All CPUs were run at DDR4-2400, which is the maximum supported at two DIMMs per channel.
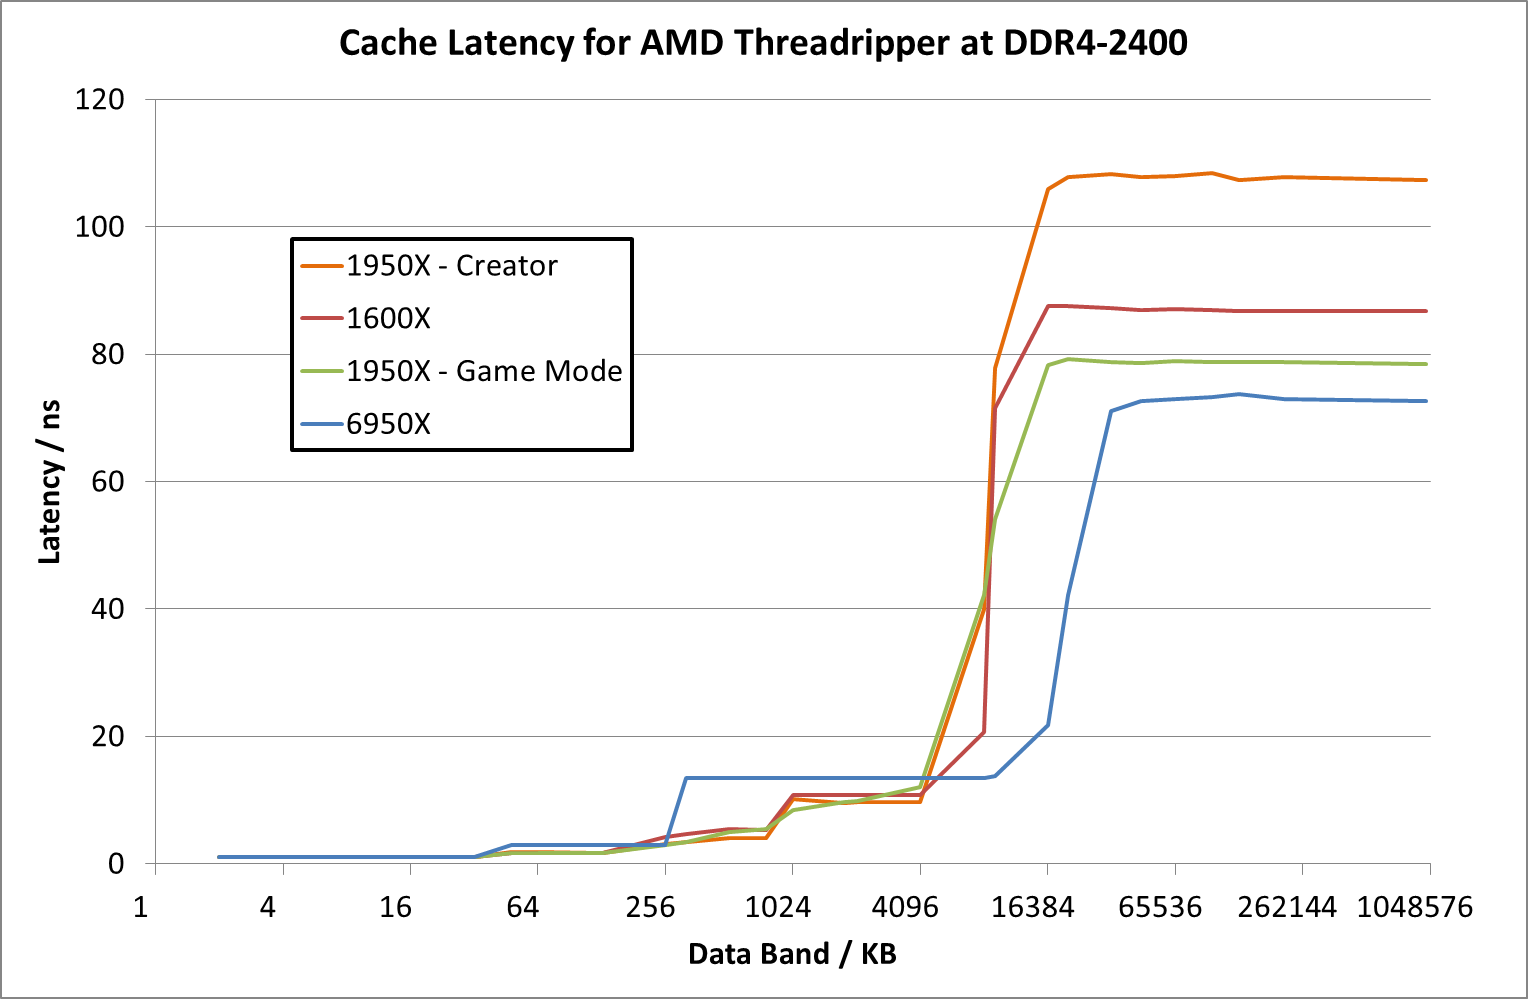
For the 1950X in the two modes, the results are essentially equal until we hit 8MB, which is the L3 cache limit per CCX. After this, the core bounces out to main memory, where the Game mode sits around 79ns while the Creator mode is at 108 ns. By comparison the Ryzen 5 1600X seems to have a lower latency at 8MB (20ns vs 41 ns), and then sits between the Creator and Game modes at 87 ns. It would appear that the bigger downside of Creator mode in this way is the fact that main memory accesses are much slower than normal Ryzen or in Game mode.
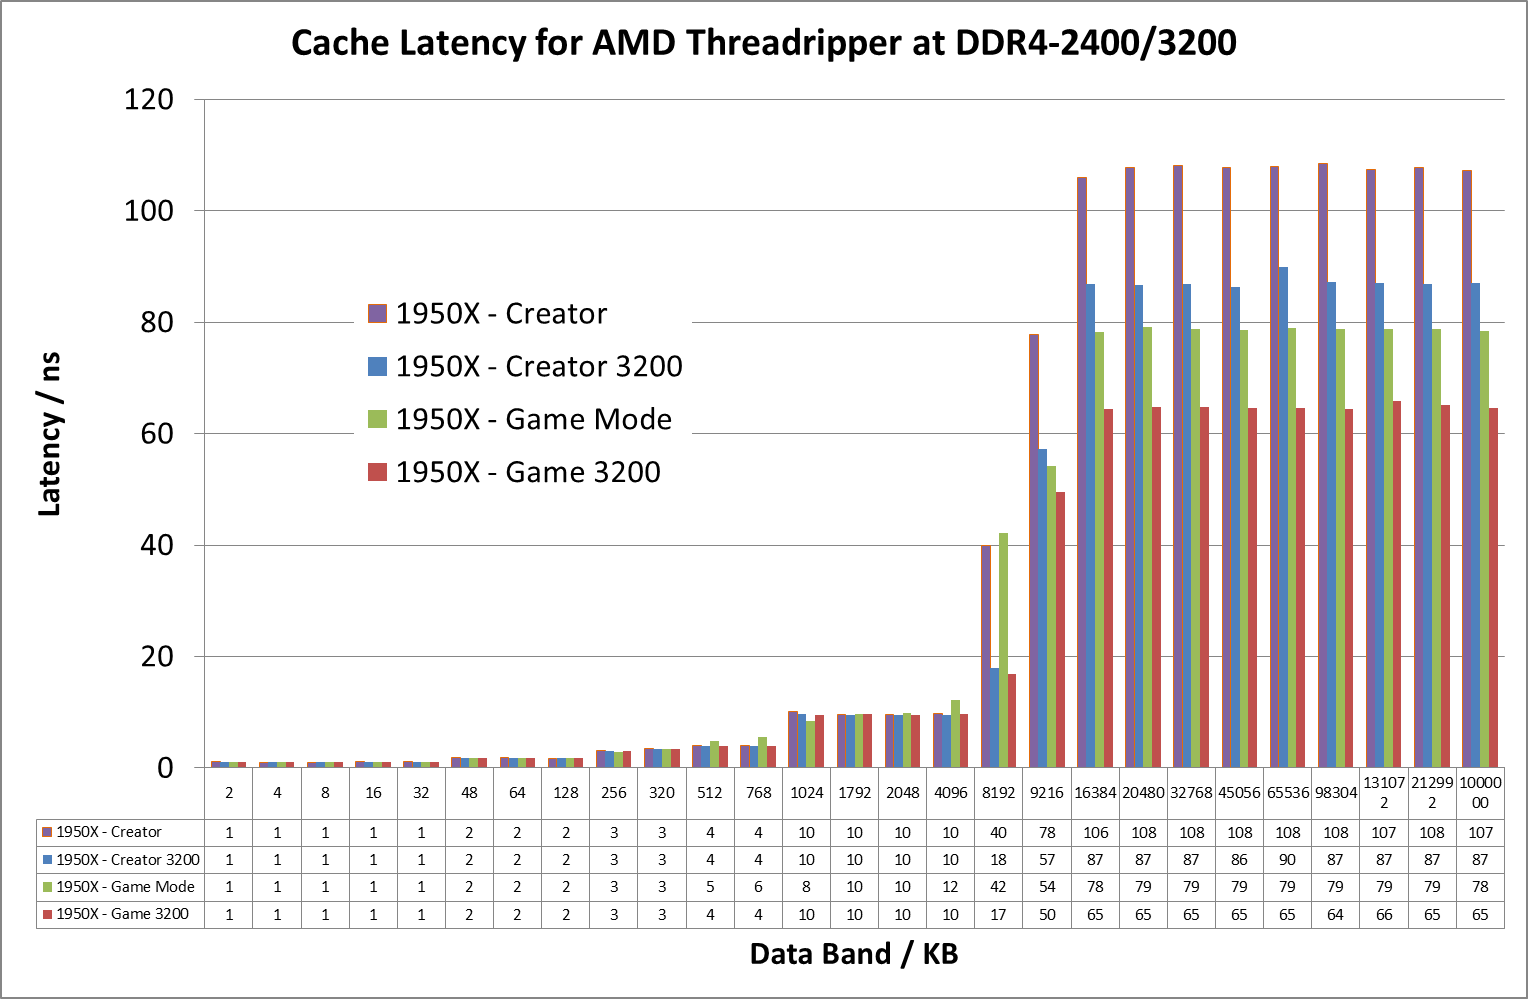
If we crank up the DRAM frequency to DDR4-3200 for the Threadripper 1950X, the numbers change a fair bit:
Click for larger image
Up until the 8MB boundary where L3 hits main memory, everything is pretty much equal. At 8MB however, the latency at DDR4-2400 is 41ns compared to 18ns at DDR4-3200. Then out into full main memory sees a pattern: Creator mode at DDR4-3200 is close to Game Mode at DDR4-2400 (87ns vs 79ns), but taking Game mode to DDR4-3200 drops the latency down to 65ns.
Another element we tested while in Game Mode was the latency for near memory and far memory as seen from a single core. Remember this slide from AMD’s deck?
In our testing, we achieved the following:
- At DDR4-2400, 79ns near memory and 136ns far memory (108ns average)
- At DDR4-3200, 65ns near memory and 108ns far memory (87ns average)
Those average numbers are what we get for Creator mode by default, indicating that the UMA mode in Creator mode will just use memory at random between the two.


Test Bed
As per our processor testing policy, we take a premium category motherboard suitable for the socket, and equip the system with a suitable amount of memory running at the manufacturer's maximum supported frequency. This is also typically run at JEDEC subtimings where possible. It is noted that some users are not keen on this policy, stating that sometimes the maximum supported frequency is quite low, or faster memory is available at a similar price, or that the JEDEC speeds can be prohibitive for performance. While these comments make sense, ultimately very few users apply memory profiles (either XMP or other) as they require interaction with the BIOS, and most users will fall back on JEDEC supported speeds - this includes home users as well as industry who might want to shave off a cent or two from the cost or stay within the margins set by the manufacturer.
| Test Setup | ||
| Processor | AMD Ryzen Threadripper 1950X (16C/32T, 3.4G, 180W) AMD Ryzen Threadripper 1920X (12C/24T, 3.5G, 180W) |
$999 $799 |
| Motherboards | ASUS X399 ROG Zenith Extreme | $549 |
| Cooling | AMD's FX-9590 Bundled Liquid Cooler (220W) | ~$80 |
| Power Supply | Corsair AX860i | $198 |
| Memory | G.Skill Trident Z RGB DDR4-3200 C14 4x8GB | $440 |
| Settings | DDR4-2400 C15 (2DPC Support) DDR4-3200 C14 (Overclock) |
|
| Video Cards | MSI GTX 1080 Gaming X 8GB ASUS GTX 1060 Strix 6GB Sapphire Nitro R9 Fury 4GB Sapphire Nitro RX 480 8GB Sapphire Nitro RX 460 4GB (CPU Tests) ASUS GTX 950 2GB 75W (SYSmark) |
$599 $349 $628 $399 $163 $??? |
| Hard Drive | Crucial MX200 1TB Crucial MX300 1TB (SYSmark) |
$310 $289 |
| Optical Drive | LG GH22NS50 | |
| Case | Open Test Bed | |
| OS | Windows 10 Pro 64-bit | $126 |
Where possible, we will extend out testing to include faster memory modules either at the same time as the review or a later date.
Many thanks to...
We must thank the following companies for kindly providing hardware for our multiple test beds. Some of this hardware is not in this test bed specifically, but is used in other testing.
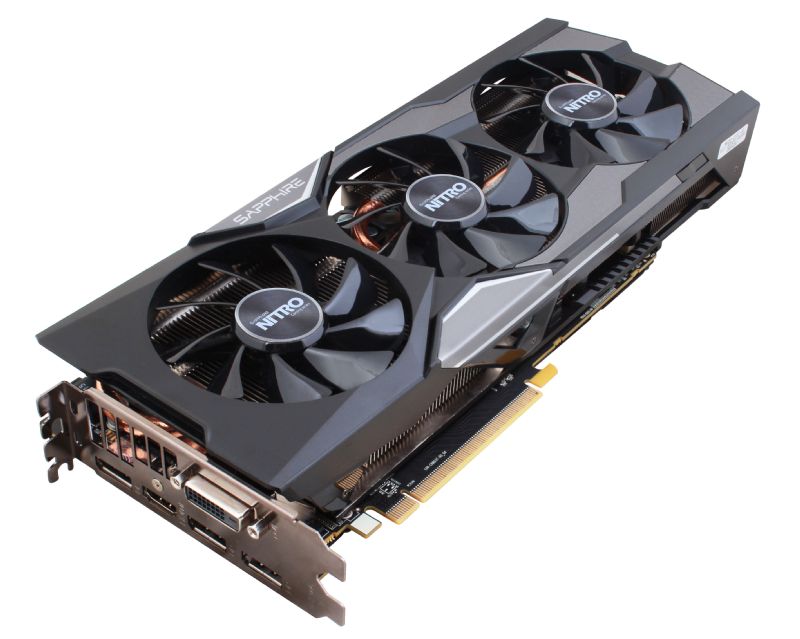
Thank you to Sapphire for providing us with several of their AMD GPUs. We met with Sapphire back at Computex 2016 and discussed a platform for our future testing on AMD GPUs with their hardware for several upcoming projects. As a result, they were able to sample us the latest silicon that AMD has to offer. At the top of the list was a pair of Sapphire Nitro R9 Fury 4GB GPUs, based on the first generation of HBM technology and AMD’s Fiji platform. As the first consumer GPU to use HDM, the R9 Fury is a key moment in graphics history, and this Nitro cards come with 3584 SPs running at 1050 MHz on the GPU with 4GB of 4096-bit HBM memory at 1000 MHz.
Further Reading: AnandTech’s Sapphire Nitro R9 Fury Review
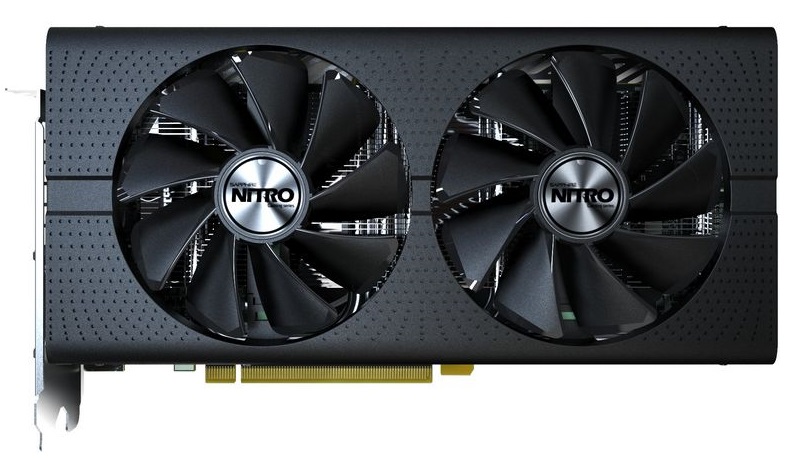
Following the Fury, Sapphire also supplied a pair of their latest Nitro RX 480 8GB cards to represent AMD’s current performance silicon on 14nm (as of March 2017). The move to 14nm yielded significant power consumption improvements for AMD, which combined with the latest version of GCN helped bring the target of a VR-ready graphics card as close to $200 as possible. The Sapphire Nitro RX 480 8GB OC graphics card is designed to be a premium member of the RX 480 family, having a full set of 8GB of GDDR5 memory at 6 Gbps with 2304 SPs at 1208/1342 MHz engine clocks.
Further Reading: AnandTech’s AMD RX 480 Review
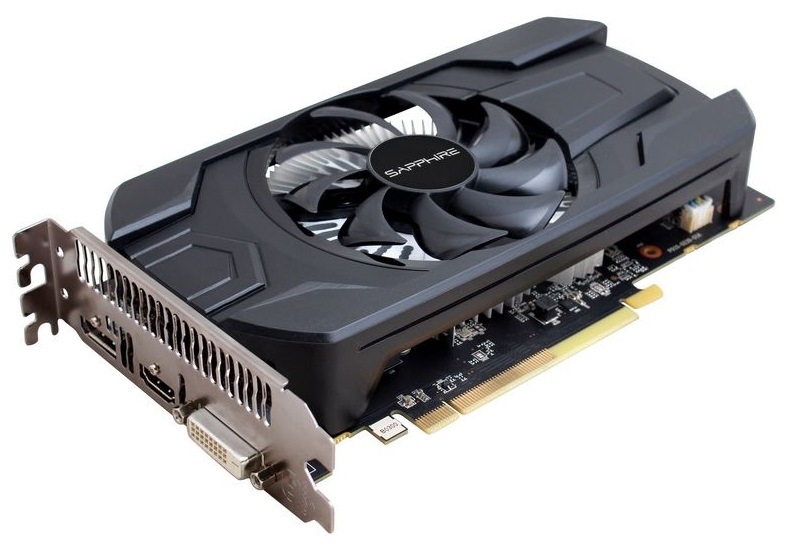
With the R9 Fury and RX 480 assigned to our gaming tests, Sapphire also passed on a pair of RX 460s to be used as our CPU testing cards. The amount of GPU power available can have a direct effect on CPU performance, especially if the CPU has to spend all its time dealing with the GPU display. The RX 460 is a nice card to have here, as it is powerful yet low on power consumption and does not require any additional power connectors. The Sapphire Nitro RX 460 2GB still follows on from the Nitro philosophy, and in this case is designed to provide power at a low price point. Its 896 SPs run at 1090/1216 MHz frequencies, and it is paired with 2GB of GDDR5 at an effective 7000 MHz.
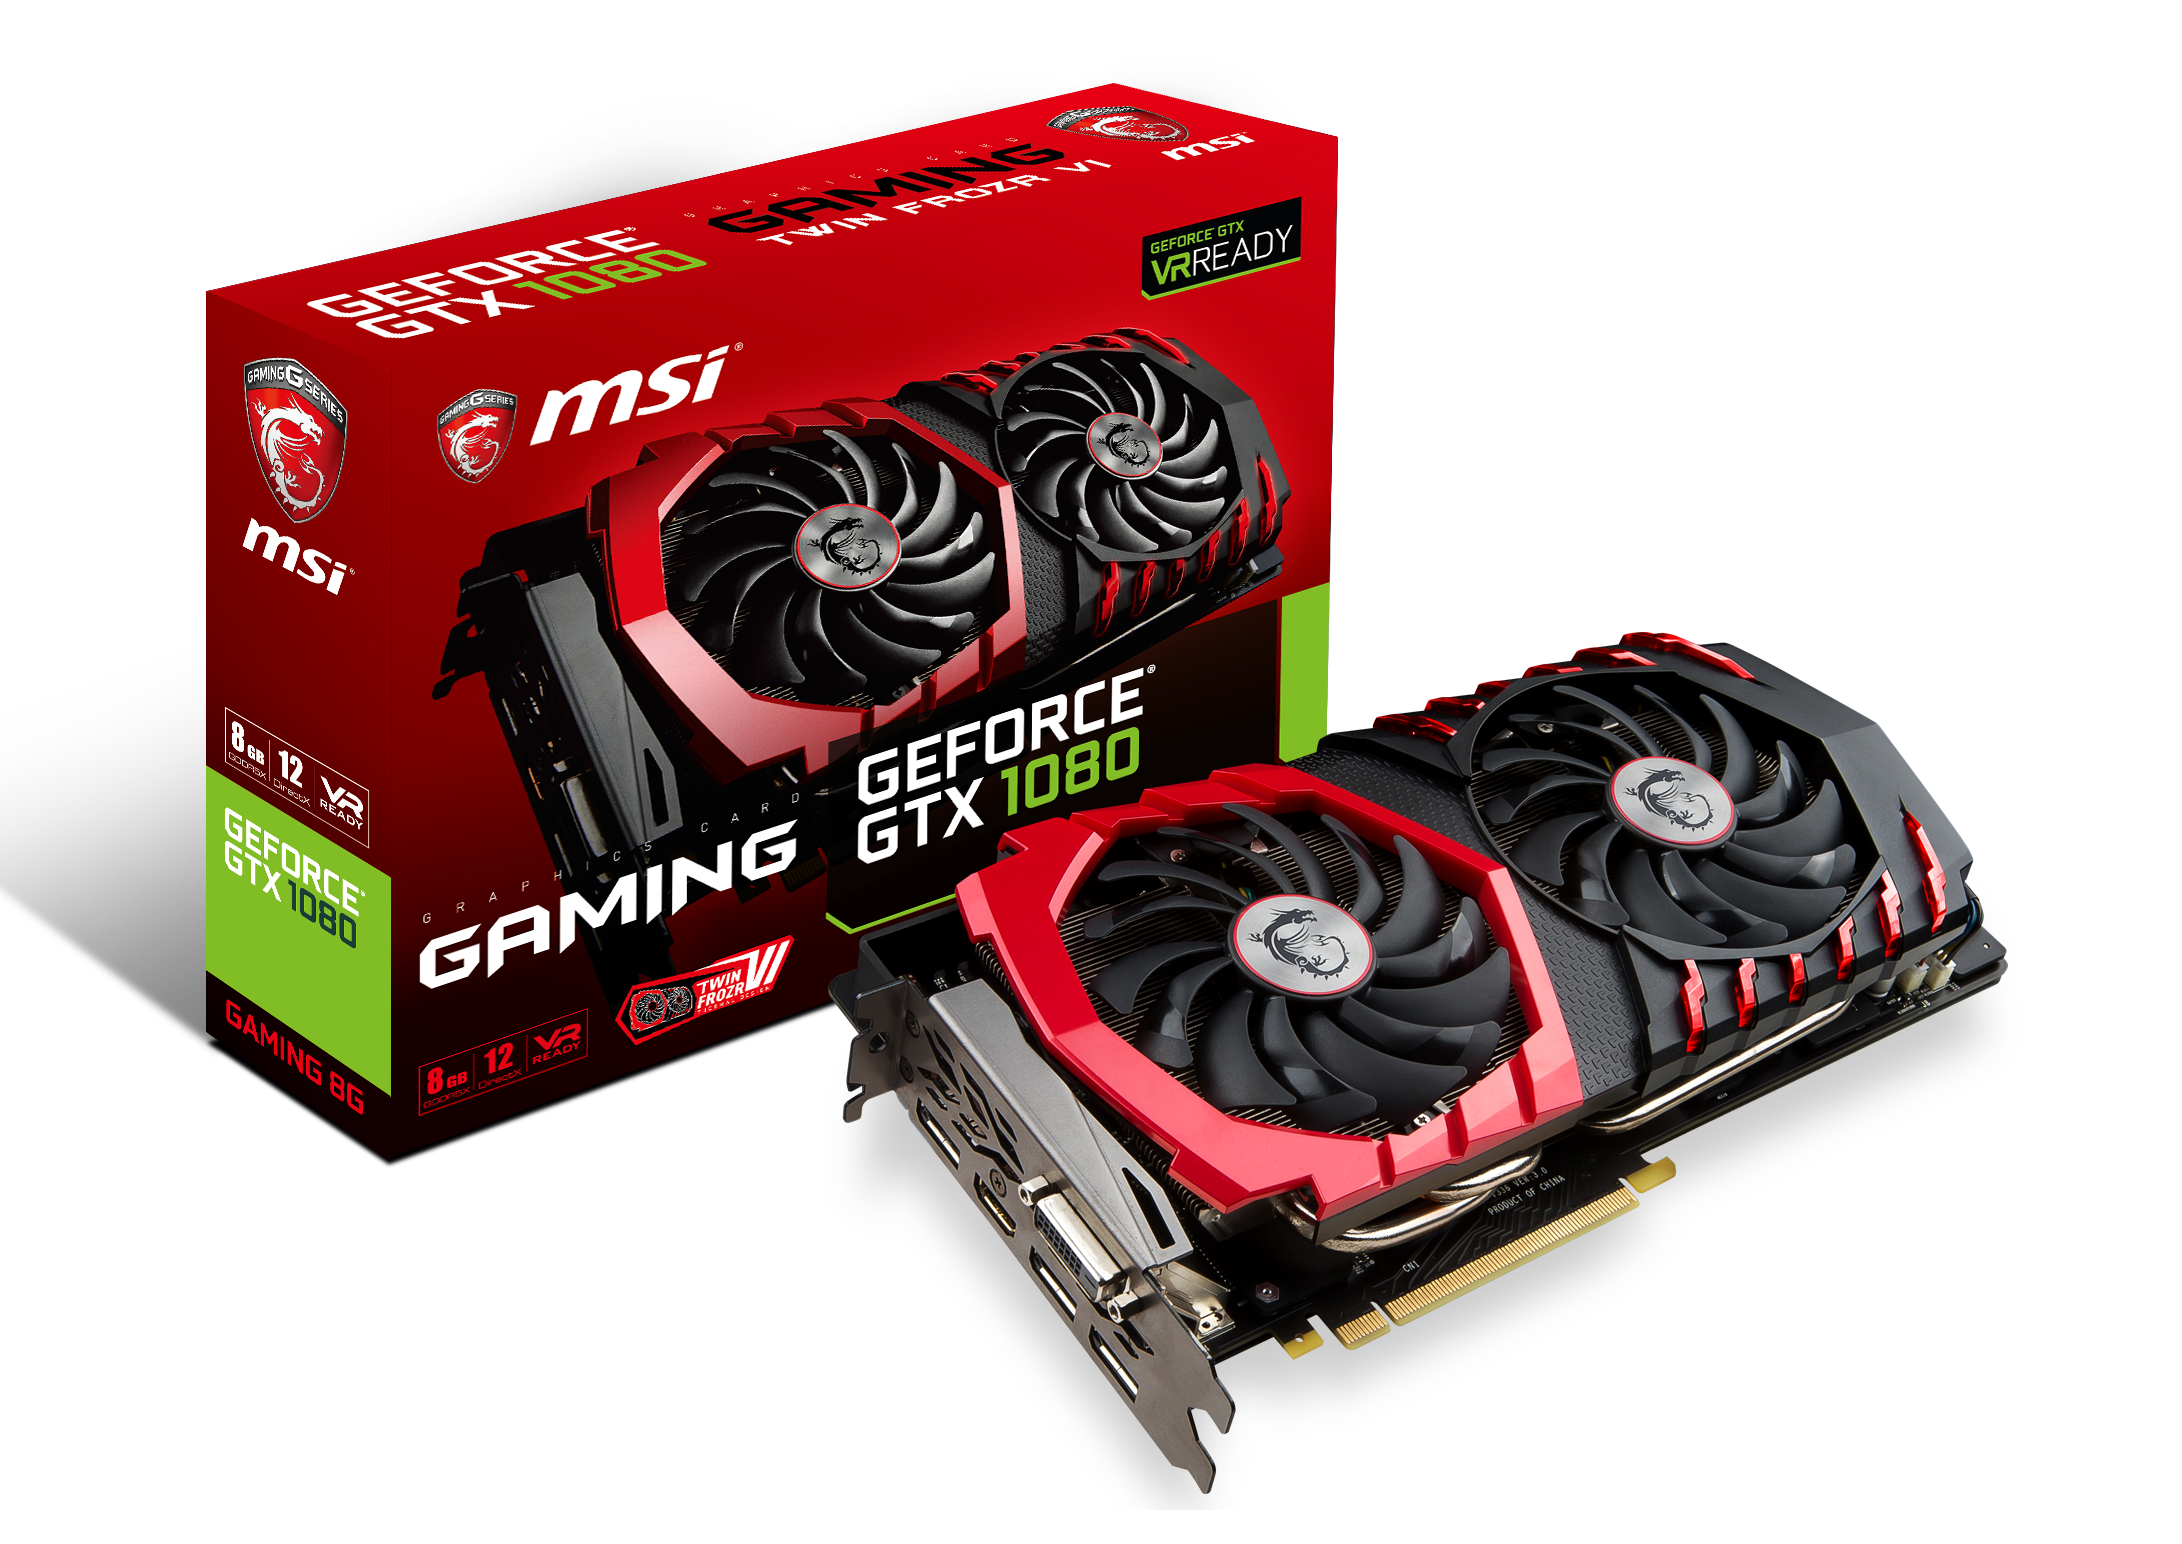
We must also say thank you to MSI for providing us with their GTX 1080 Gaming X 8GB GPUs. Despite the size of AnandTech, securing high-end graphics cards for CPU gaming tests is rather difficult. MSI stepped up to the plate in good fashion and high spirits with a pair of their high-end graphics. The MSI GTX 1080 Gaming X 8GB graphics card is their premium air cooled product, sitting below the water cooled Seahawk but above the Aero and Armor versions. The card is large with twin Torx fans, a custom PCB design, Zero-Frozr technology, enhanced PWM and a big backplate to assist with cooling. The card uses a GP104-400 silicon die from a 16nm TSMC process, contains 2560 CUDA cores, and can run up to 1847 MHz in OC mode (or 1607-1733 MHz in Silent mode). The memory interface is 8GB of GDDR5X, running at 10010 MHz. For a good amount of time, the GTX 1080 was the card at the king of the hill.
Further Reading: AnandTech’s NVIDIA GTX 1080 Founders Edition Review
Thank you to ASUS for providing us with their GTX 1060 6GB Strix GPU. To complete the high/low cases for both AMD and NVIDIA GPUs, we looked towards the GTX 1060 6GB cards to balance price and performance while giving a hefty crack at >1080p gaming in a single graphics card. ASUS lended a hand here, supplying a Strix variant of the GTX 1060. This card is even longer than our GTX 1080, with three fans and LEDs crammed under the hood. STRIX is now ASUS’ lower cost gaming brand behind ROG, and the Strix 1060 sits at nearly half a 1080, with 1280 CUDA cores but running at 1506 MHz base frequency up to 1746 MHz in OC mode. The 6 GB of GDDR5 runs at a healthy 8008 MHz across a 192-bit memory interface.
Further Reading: AnandTech’s ASUS GTX 1060 6GB STRIX Review
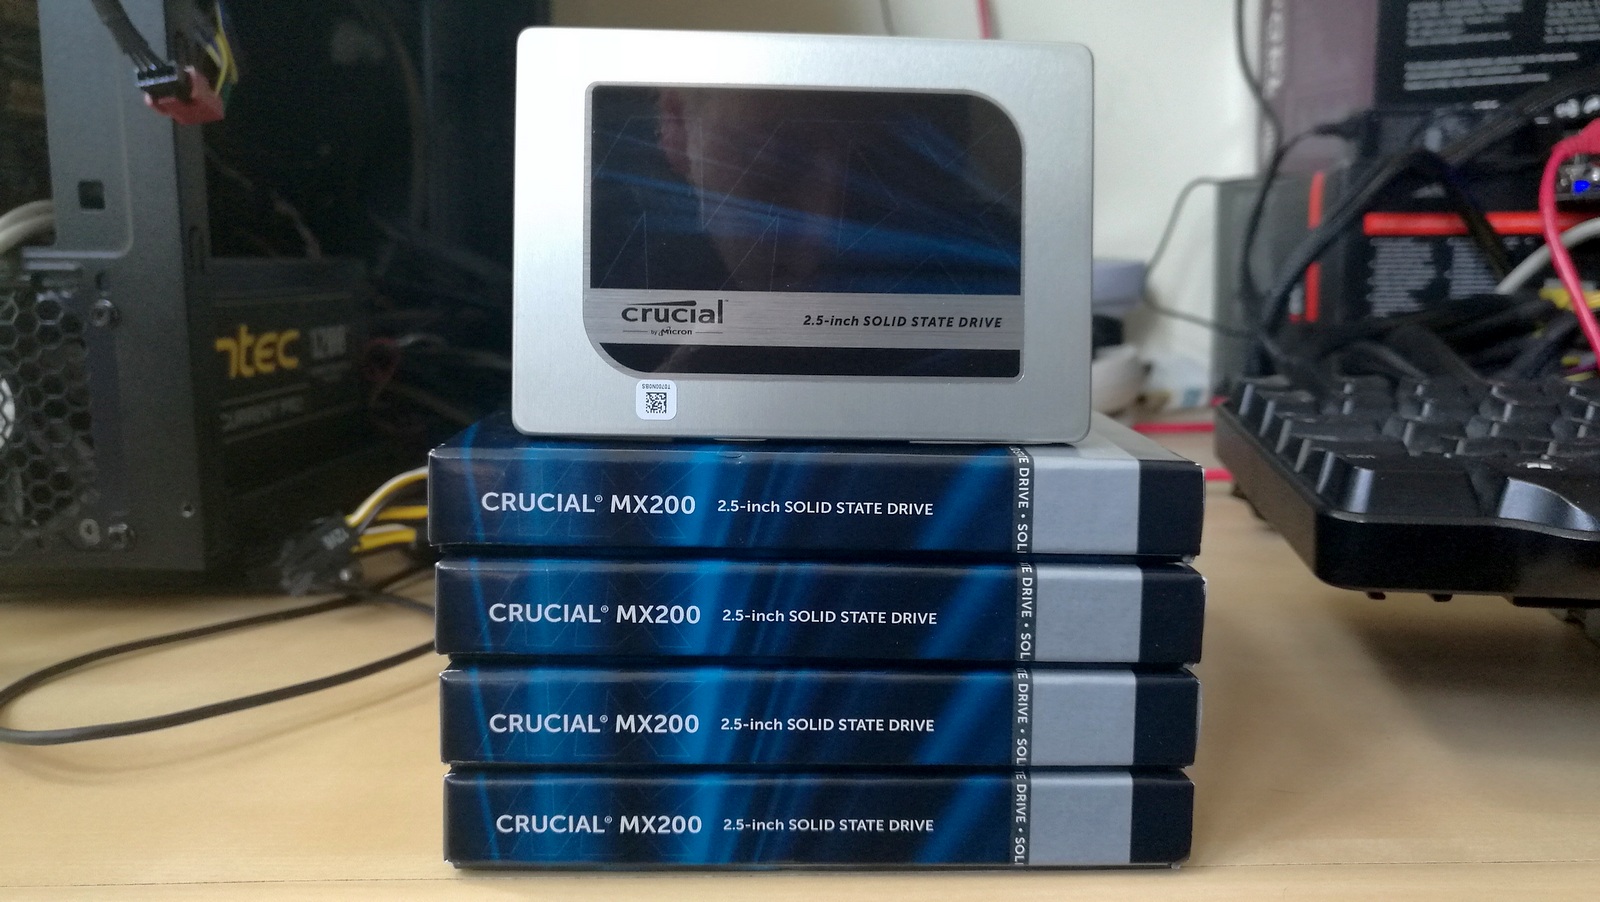
Thank you to Crucial for providing us with MX200 SSDs. Crucial stepped up to the plate as our benchmark list grows larger with newer benchmarks and titles, and the 1TB MX200 units are strong performers. Based on Marvell's 88SS9189 controller and using Micron's 16nm 128Gbit MLC flash, these are 7mm high, 2.5-inch drives rated for 100K random read IOPs and 555/500 MB/s sequential read and write speeds. The 1TB models we are using here support TCG Opal 2.0 and IEEE-1667 (eDrive) encryption and have a 320TB rated endurance with a three-year warranty.
Further Reading: AnandTech's Crucial MX200 (250 GB, 500 GB & 1TB) Review
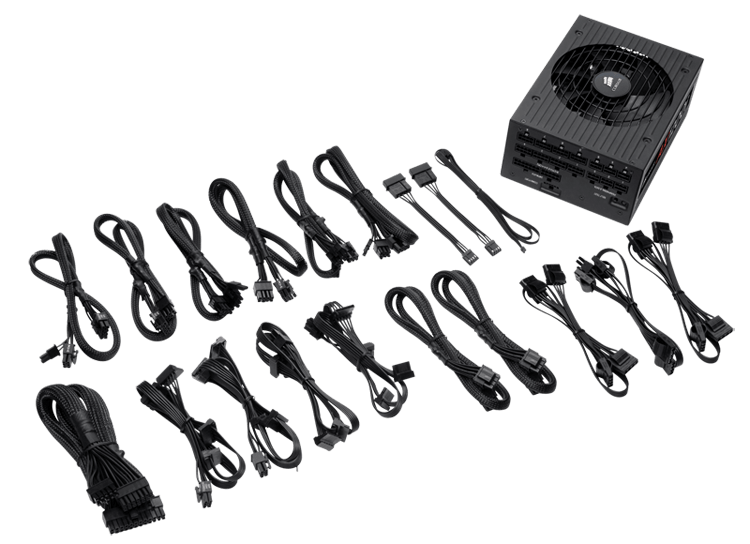
Thank you to Corsair for providing us with an AX1200i PSU. The AX1200i was the first power supply to offer digital control and management via Corsair's Link system, but under the hood it commands a 1200W rating at 50C with 80 PLUS Platinum certification. This allows for a minimum 89-92% efficiency at 115V and 90-94% at 230V. The AX1200i is completely modular, running the larger 200mm design, with a dual ball bearing 140mm fan to assist high-performance use. The AX1200i is designed to be a workhorse, with up to 8 PCIe connectors for suitable four-way GPU setups. The AX1200i also comes with a Zero RPM mode for the fan, which due to the design allows the fan to be switched off when the power supply is under 30% load.
Further Reading: AnandTech's Corsair AX1500i Power Supply Review
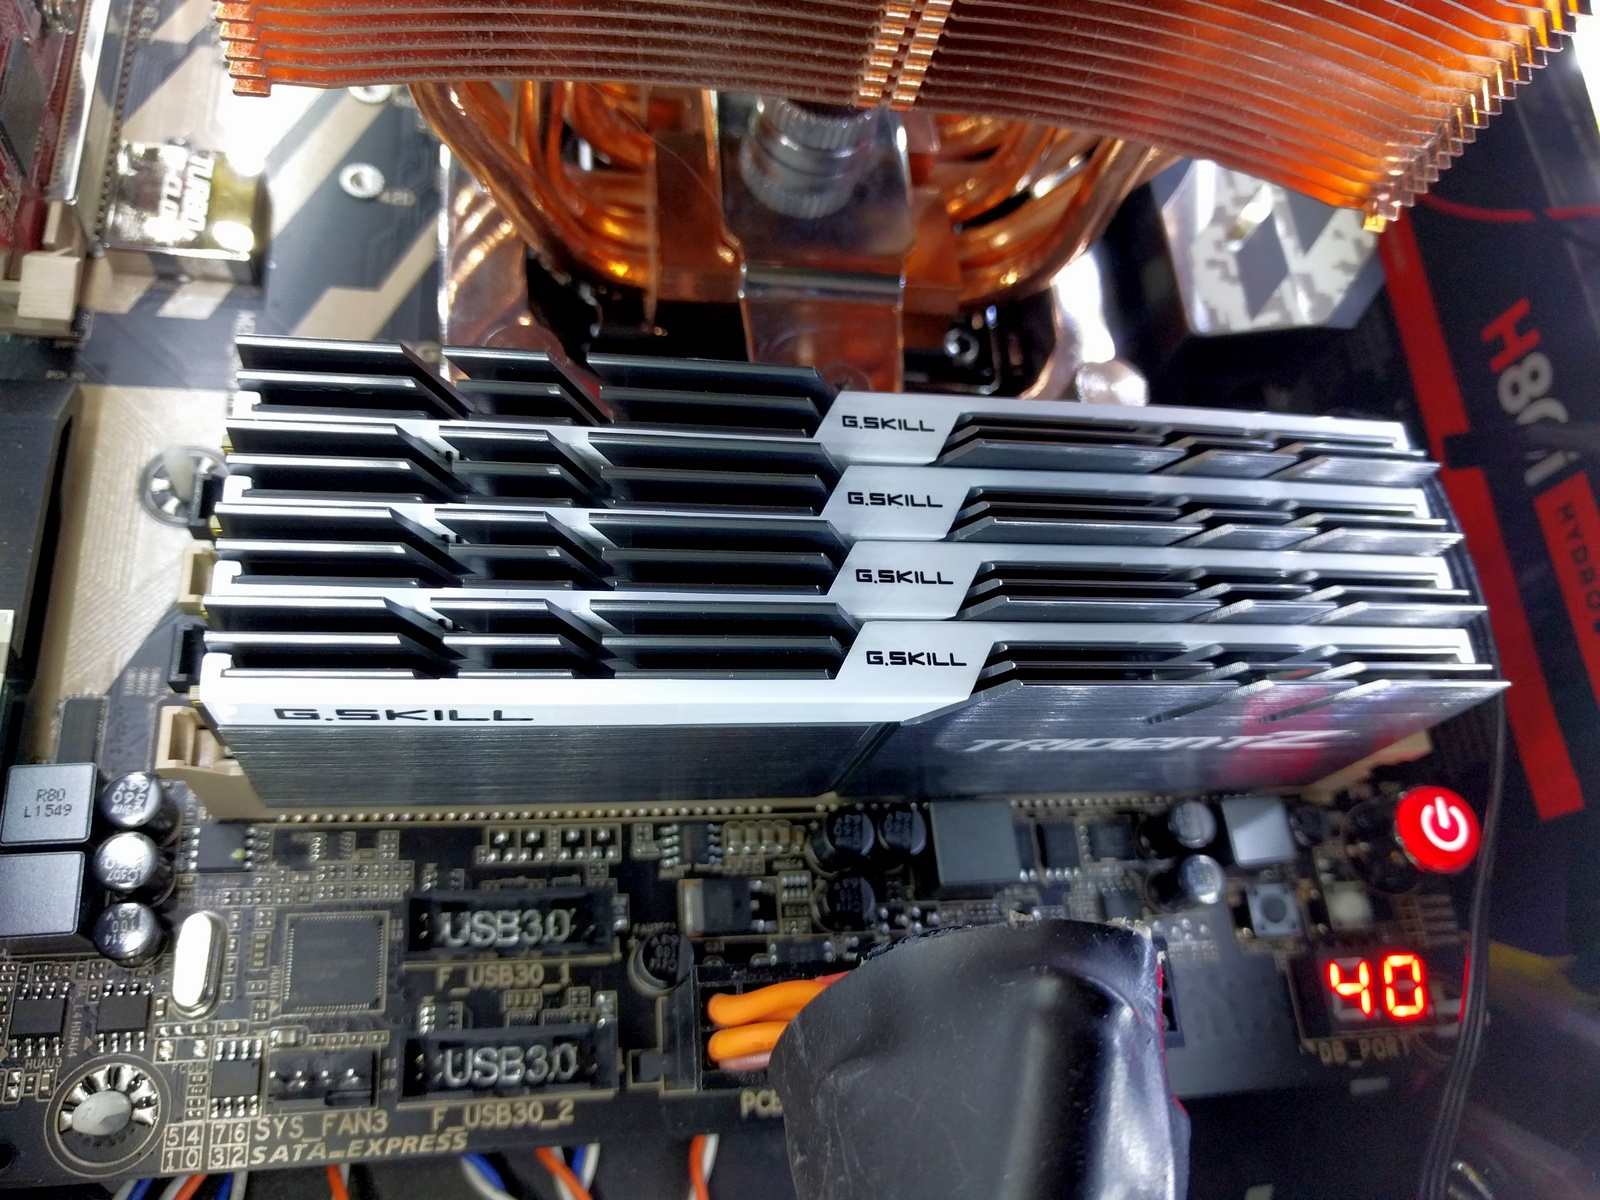
Thank you to G.Skill for providing us with memory. G.Skill has been a long-time supporter of AnandTech over the years, for testing beyond our CPU and motherboard memory reviews. We've reported on their high capacity and high-frequency kits, and every year at Computex G.Skill holds a world overclocking tournament with liquid nitrogen right on the show floor.
Further Reading: AnandTech's Memory Scaling on Haswell Review, with G.Skill DDR3-3000
The 2017 Benchmark Suite
For our review, we are implementing our fresh CPU testing benchmark suite, using new scripts developed specifically for this testing. This means that with a fresh OS install, we can configure the OS to be more consistent, install the new benchmarks, maintain version consistency without random updates and start running the tests in under 5 minutes. After that it's a one button press to start an 8-10hr test (with a high-performance core) with nearly 100 relevant data points in the benchmarks given below for CPUs, followed by our CPU gaming tests which run for 4-5 hours for each of the GPUs used. The CPU tests cover a wide range of segments, some of which will be familiar but some of the tests are new to benchmarking in general, but still highly relevant for the markets they come from.
Our new CPU tests go through six main areas. We cover the Web (we've got an un-updateable version of Chrome 56), general system tests (opening tricky PDFs, emulation, brain simulation, AI, 2D image to 3D model conversion), rendering (ray tracing, modeling), encoding (compression, AES, h264 and HEVC), office based tests (PCMark and others), and our legacy tests, throwbacks from another generation of bad code but interesting to compare.
All of our benchmark results can also be found in our benchmark engine, Bench.
A side note on OS preparation. As we're using Windows 10, there's a large opportunity for something to come in and disrupt our testing. So our default strategy is multiple: disable the ability to update as much as possible, disable Windows Defender, uninstall OneDrive, disable Cortana as much as possible, implement the high performance mode in the power options, and disable the internal platform clock which can drift away from being accurate if the base frequency drifts (and thus the timing ends up inaccurate).
Web Tests on Chrome 56
Sunspider 1.0.2
Mozilla Kraken 1.1
Google Octane 2.0
WebXPRT15
System Tests
PDF Opening
FCAT
3DPM v2.1
Dolphin v5.0
DigiCortex v1.20
Agisoft PhotoScan v1.0
Rendering Tests
Corona 1.3
Blender 2.78
LuxMark v3.1 CPU C++
LuxMark v3.1 CPU OpenCL
POV-Ray 3.7.1b4
Cinebench R15 ST
Cinebench R15 MT
Encoding Tests
7-Zip 9.2
WinRAR 5.40
AES Encoding (TrueCrypt 7.2)
HandBrake v1.0.2 x264 LQ
HandBrake v1.0.2 x264-HQ
HandBrake v1.0.2 HEVC-4K
Office / Professional
PCMark8
Chromium Compile (v56)
SYSmark 2014 SE
Legacy Tests
3DPM v1 ST / MT
x264 HD 3 Pass 1, Pass 2
Cinebench R11.5 ST / MT
Cinebench R10 ST / MT
CPU Gaming Tests
For our new set of GPU tests, we wanted to think big. There are a lot of users in the ecosystem that prioritize gaming above all else, especially when it comes to choosing the correct CPU. If there's a chance to save $50 and get a better graphics card for no loss in performance, then this is the route that gamers would prefer to tread. The angle here though is tough - lots of games have different requirements and cause different stresses on a system, with various graphics cards having different reactions to the code flow of a game. Then users also have different resolutions and different perceptions of what feels 'normal'. This all amounts to more degrees of freedom than we could hope to test in a lifetime, only for the data to become irrelevant in a few months when a new game or new GPU comes into the mix. Just for good measure, let us add in DirectX 12 titles that make it easier to use more CPU cores in a game to enhance fidelity.
Our original list of nine games planned in February quickly became six, due to the lack of professional-grade controls on Ubisoft titles. If you want to see For Honor, Steep or Ghost Recon: Wildlands benchmarked on AnandTech, please point Ubisoft Annecy or Ubisoft Montreal in my direction. While these games have in-game benchmarks worth using, unfortunately they do not provide enough frame-by-frame detail to the end user, despite using it internally to produce the data the user eventually sees (and it typically ends up obfuscated by another layer as well). I would instead perhaps choose to automate these benchmarks via inputs, however the extremely variable loading time is a strong barrier to this.
So we have the following benchmarks as part of our 4/2 script, automated to the point of a one-button run and out pops the results four hours later, per GPU. Also listed are the resolutions and settings used.
- Civilization 6 (1080p Ultra, 4K Ultra)
- Ashes of the Singularity: Escalation* (1080p Extreme, 4K Extreme)
- Shadow of Mordor (1080p Ultra, 4K Ultra)
- Rise of the Tomb Raider #1 - GeoValley (1080p High, 4K Medium)
- Rise of the Tomb Raider #2 - Prophets (1080p High, 4K Medium)
- Rise of the Tomb Raider #3 - Mountain (1080p High, 4K Medium)
- Rocket League (1080p Ultra, 4K Ultra)
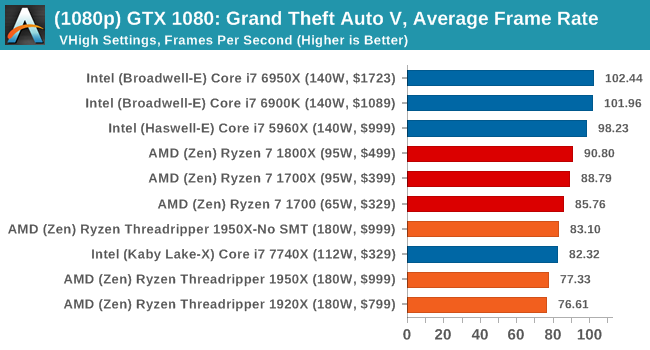
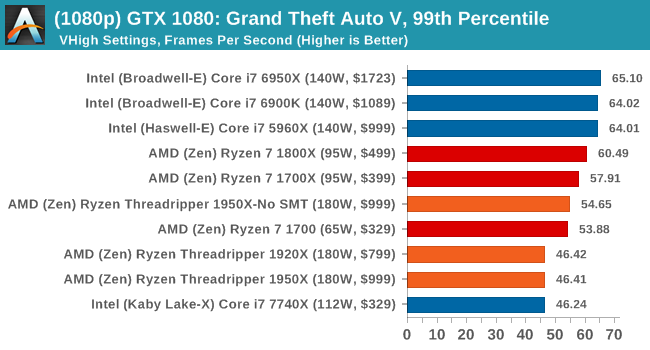
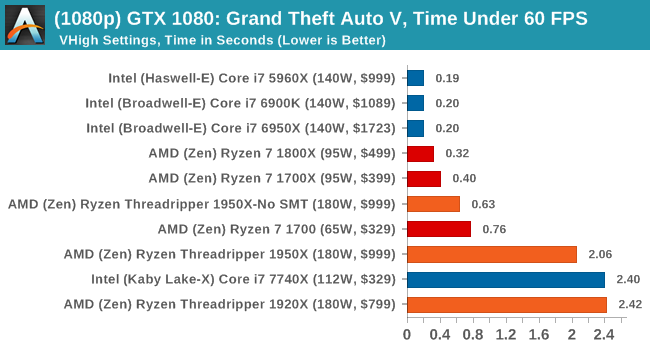
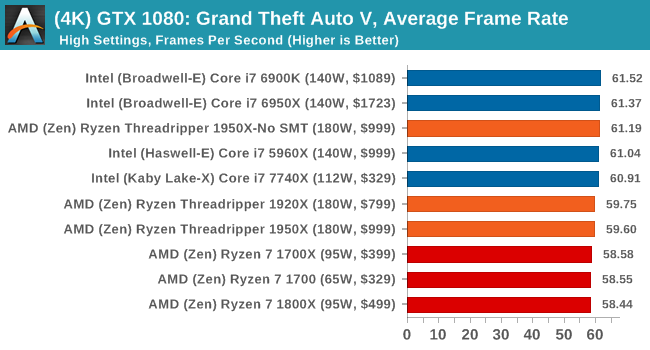
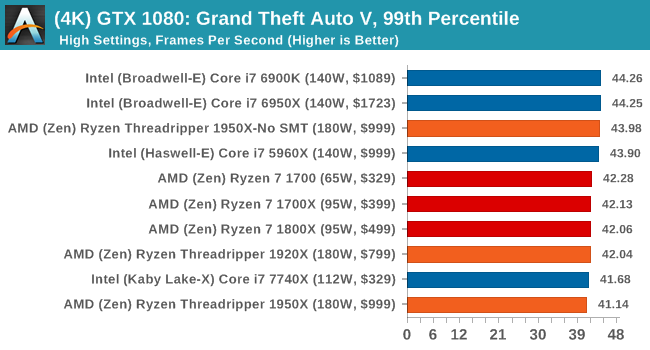
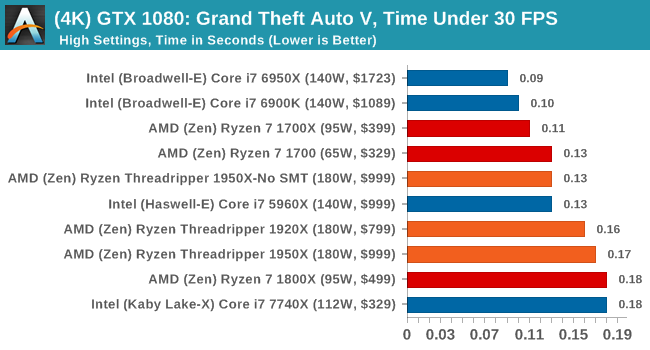
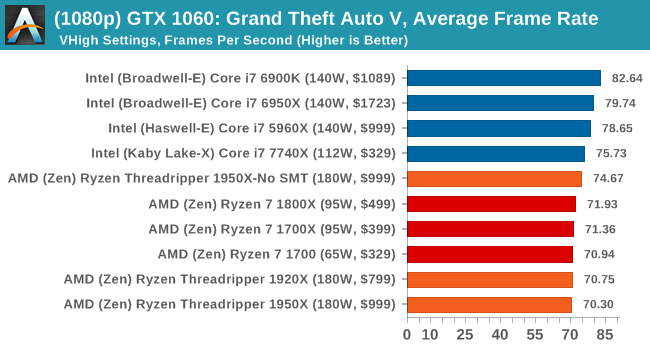
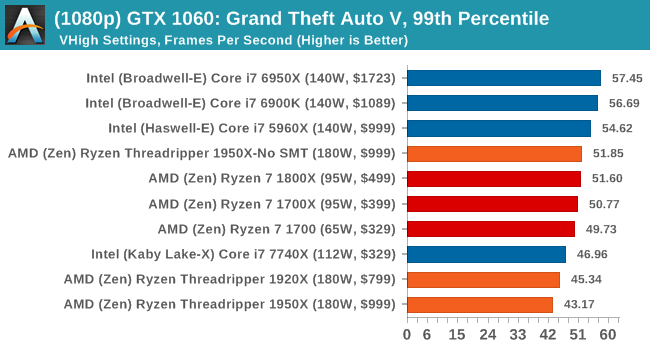
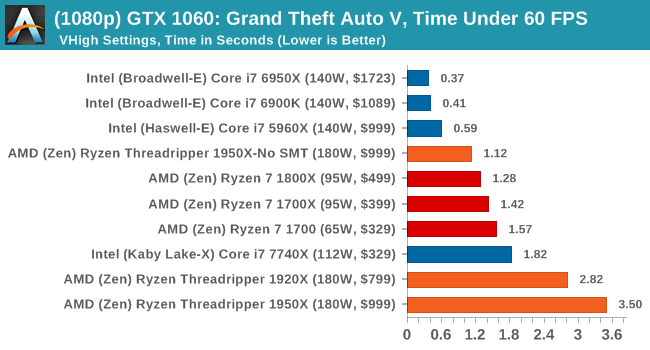
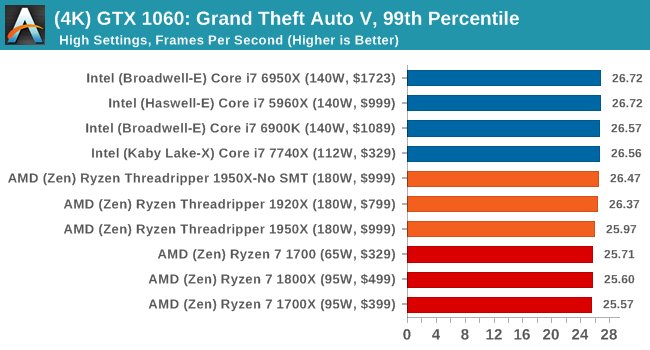
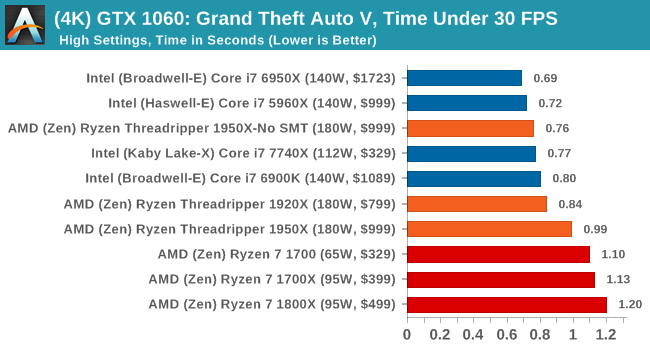
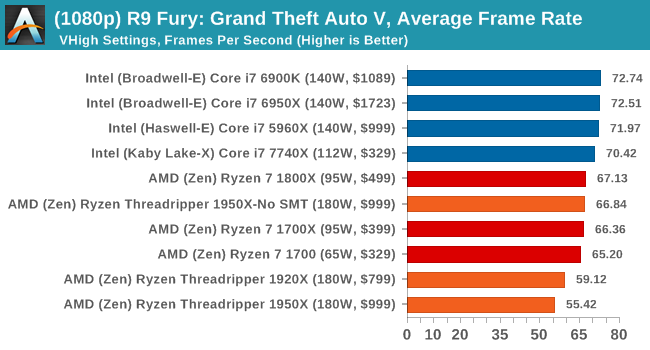
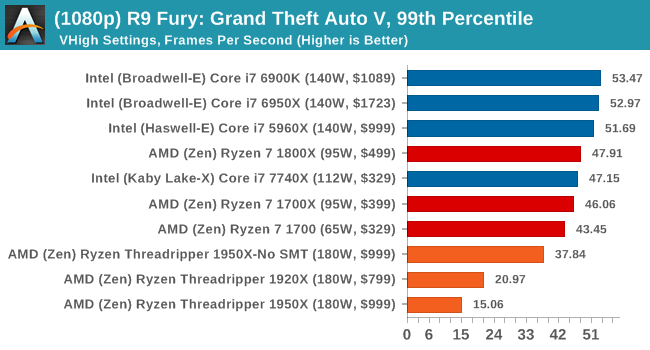
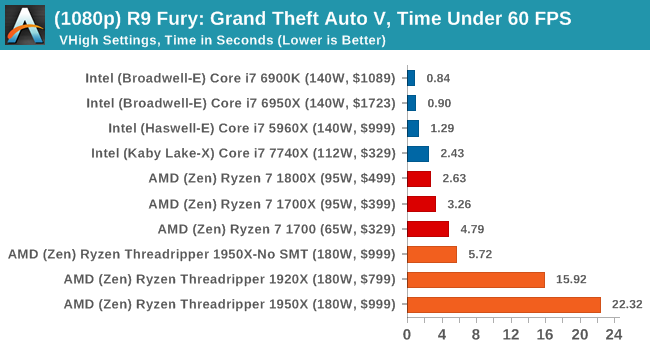
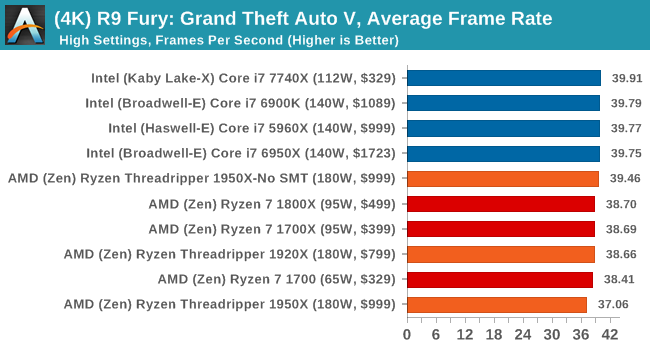
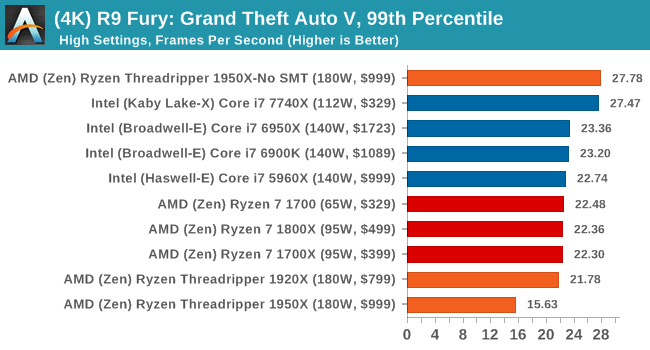
- Grand Theft Auto V (1080p Very High, 4K High)
For each of the GPUs in our testing, these games (at each resolution/setting combination) are run four times each, with outliers discarded. Average frame rates, 99th percentiles and 'Time Under x FPS' data is sorted, and the raw data is archived.
The four GPUs we've managed to obtain for these tests are:
- MSI GTX 1080 Gaming X 8G
- ASUS GTX 1060 Strix 6G
- Sapphire Nitro R9 Fury 4GB
- Sapphire Nitro RX 480 8GB
In our testing script, we save a couple of special things for the GTX 1080 here. The following tests are also added:
- Civilization 6 (8K Ultra, 16K Lowest)
This benchmark, with a little coercion, are able to be run beyond the specifications of the monitor being used, allowing for 'future' testing of GPUs at 8K and 16K with some amusing results. We are only running these tests on the GTX 1080, because there's no point watching a slideshow more than once.
*As an additional to this review, we do not have any CPU gaming data on Skylake-X. We ran a set of tests before Threadripper arrived, but now having had a chance to analyze the data, despite being on the latest BIOS and setup, there are still issues with performance that we need to nail down once this review is out of the way.
CPU System Tests
Our first set of tests is our general system tests. These set of tests are meant to emulate more about what people usually do on a system, like opening large files or processing small stacks of data. This is a bit different to our office testing, which uses more industry standard benchmarks, and a few of the benchmarks here are relatively new and different.
All of our benchmark results can also be found in our benchmark engine, Bench.
PDF Opening
First up is a self-penned test using a monstrous PDF we once received in advance of attending an event. While the PDF was only a single page, it had so many high-quality layers embedded it was taking north of 15 seconds to open and to gain control on the mid-range notebook I was using at the time. This put it as a great candidate for our 'let's open an obnoxious PDF' test. Here we use Adobe Reader DC, and disable all the update functionality within. The benchmark sets the screen to 1080p, opens the PDF to in fit-to-screen mode, and measures the time from sending the command to open the PDF until it is fully displayed and the user can take control of the software again. The test is repeated ten times, and the average time taken. Results are in milliseconds.
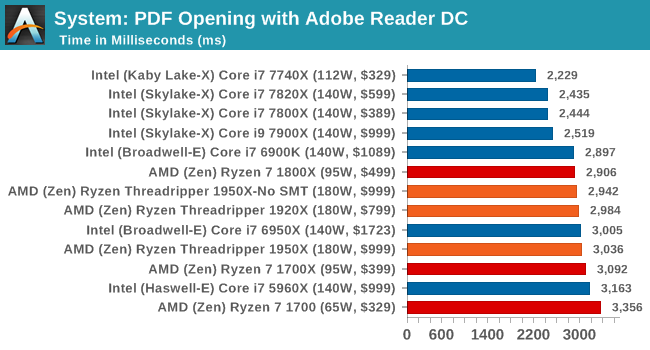
This opening test is single threaded, so the high-frequency Intel parts get a clear win. There's not much between the Threadripper CPUs here.
FCAT Processing: link
One of the more interesting workloads that has crossed our desks in recent quarters is FCAT - the tool we use to measure and visually analyze stuttering in gaming due to dropped or runt frames. The FCAT process requires enabling a color-based overlay onto a game, recording the gameplay, and then parsing the video file through the analysis software. The software is mostly single-threaded, however because the video is basically in a raw format, the file size is large and requires moving a lot of data around. For our test, we take a 90-second clip of the Rise of the Tomb Raider benchmark running on a GTX 980 Ti at 1440p, which comes in around 21 GB, and measure the time it takes to process through the visual analysis tool.
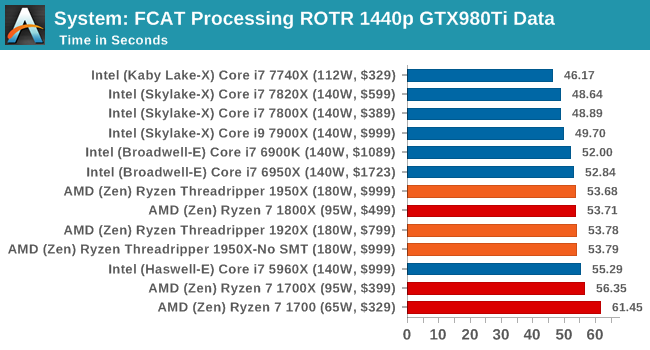
Similar to PDF opening, single threaded performance wins out.
Dolphin Benchmark: link
Many emulators are often bound by single thread CPU performance, and general reports tended to suggest that Haswell provided a significant boost to emulator performance. This benchmark runs a Wii program that ray traces a complex 3D scene inside the Dolphin Wii emulator. Performance on this benchmark is a good proxy of the speed of Dolphin CPU emulation, which is an intensive single core task using most aspects of a CPU. Results are given in minutes, where the Wii itself scores 17.53 minutes.
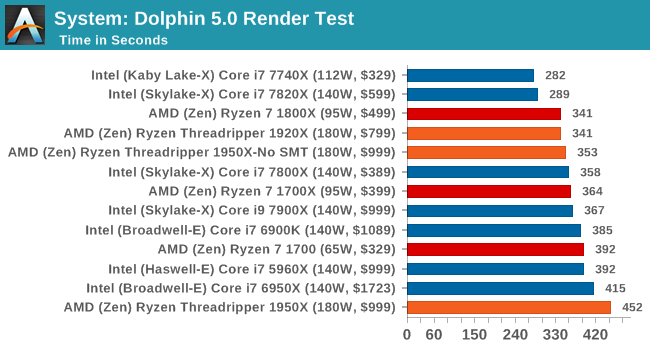
Dolphin likes single thread performance as well, although having some cores to back it up seems to be required.
3D Movement Algorithm Test v2.1: link
This is the latest version of the self-penned 3DPM benchmark. The goal of 3DPM is to simulate semi-optimized scientific algorithms taken directly from my doctorate thesis. Version 2.1 improves over 2.0 by passing the main particle structs by reference rather than by value, and decreasing the amount of double->float->double recasts the compiler was adding in. It affords a ~25% speed-up over v2.0, which means new data.

Our first pure multithreaded test, and the 1950X wins with 32 threads. The 1920X beats the 1950X in SMT-off mode, due to 24 threads beating 16 threads.
DigiCortex v1.20: link
Despite being a couple of years old, the DigiCortex software is a pet project for the visualization of neuron and synapse activity in the brain. The software comes with a variety of benchmark modes, and we take the small benchmark which runs a 32k neuron/1.8B synapse simulation. The results on the output are given as a fraction of whether the system can simulate in real-time, so anything above a value of one is suitable for real-time work. The benchmark offers a 'no firing synapse' mode, which in essence detects DRAM and bus speed, however we take the firing mode which adds CPU work with every firing.
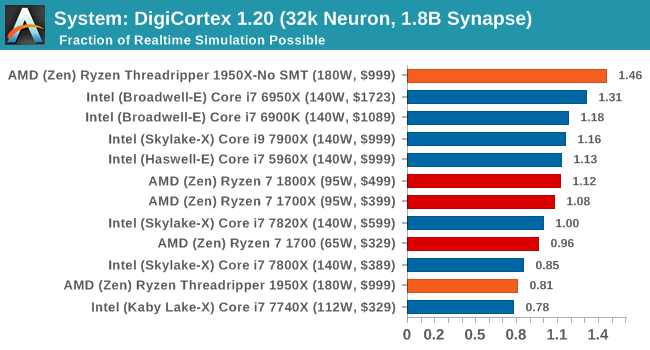
DigiCortex requires a mash of CPU frequency and DRAM performance to get a good result, and anything with quad-channel memory is usually preferred. The 1950X in SMT-off mode wins here due to its low main memory latency combined with having 16 threads to access it. The Broadwell-E is the nearest competitor, over Skylake-X, most likely due to the mesh vs ring topology. The 1950X in Creator mode scores way down the field however, lower than the standard Ryzen chips, showing that under a unified memory architecture there can be significant performance drops. The 1920X failed in this test for an unknown reason.
Agisoft Photoscan 1.0: link
Photoscan stays in our benchmark suite from the previous version, however now we are running on Windows 10 so features such as Speed Shift on the latest processors come into play. The concept of Photoscan is translating many 2D images into a 3D model - so the more detailed the images, and the more you have, the better the model. The algorithm has four stages, some single threaded and some multi-threaded, along with some cache/memory dependency in there as well. For some of the more variable threaded workload, features such as Speed Shift and XFR will be able to take advantage of CPU stalls or downtime, giving sizeable speedups on newer microarchitectures.
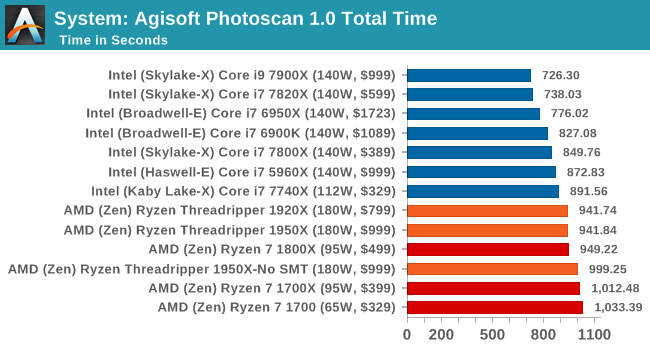
The variable threaded nature of Agisoft shows that in our workflow, it's a mix of cores, IPC and frequency required to win. AMD takes a back seat here, likely due to its AVX implementation.
CPU Rendering Tests
Rendering tests are a long-time favorite of reviewers and benchmarkers, as the code used by rendering packages is usually highly optimized to squeeze every little bit of performance out. Sometimes rendering programs end up being heavily memory dependent as well - when you have that many threads flying about with a ton of data, having low latency memory can be key to everything. Here we take a few of the usual rendering packages under Windows 10, as well as a few new interesting benchmarks.
All of our benchmark results can also be found in our benchmark engine, Bench.
Corona 1.3: link
Corona is a standalone package designed to assist software like 3ds Max and Maya with photorealism via ray tracing. It's simple - shoot rays, get pixels. OK, it's more complicated than that, but the benchmark renders a fixed scene six times and offers results in terms of time and rays per second. The official benchmark tables list user submitted results in terms of time, however I feel rays per second is a better metric (in general, scores where higher is better seem to be easier to explain anyway). Corona likes to pile on the threads, so the results end up being very staggered based on thread count.
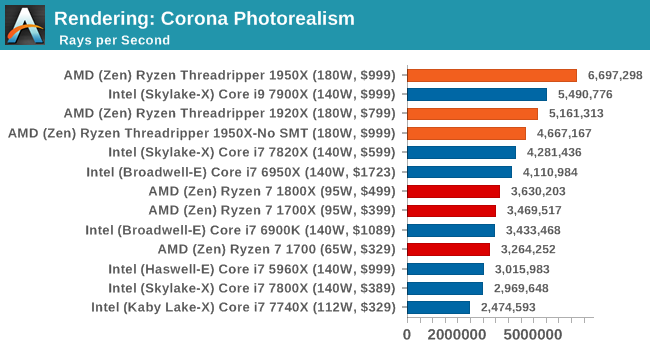
Corona loves threads.
Blender 2.78: link
For a render that has been around for what seems like ages, Blender is still a highly popular tool. We managed to wrap up a standard workload into the February 5 nightly build of Blender and measure the time it takes to render the first frame of the scene. Being one of the bigger open source tools out there, it means both AMD and Intel work actively to help improve the codebase, for better or for worse on their own/each other's microarchitecture.
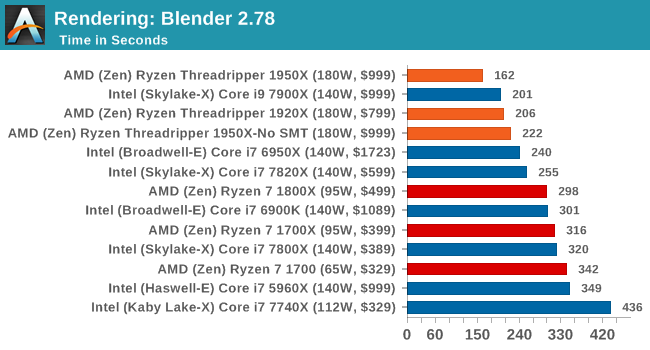
Blender loves threads and memory bandwidth.
LuxMark v3.1: Link
As a synthetic, LuxMark might come across as somewhat arbitrary as a renderer, given that it's mainly used to test GPUs, but it does offer both an OpenCL and a standard C++ mode. In this instance, aside from seeing the comparison in each coding mode for cores and IPC, we also get to see the difference in performance moving from a C++ based code-stack to an OpenCL one with a CPU as the main host.
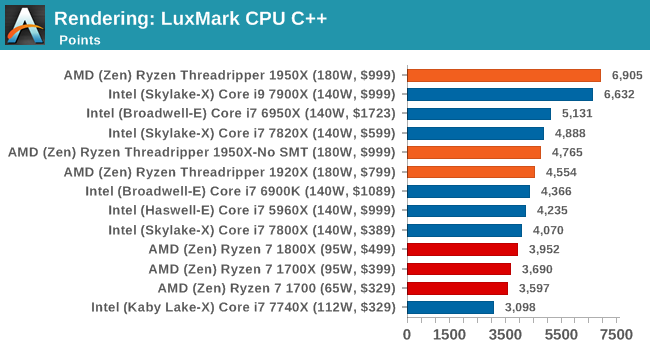
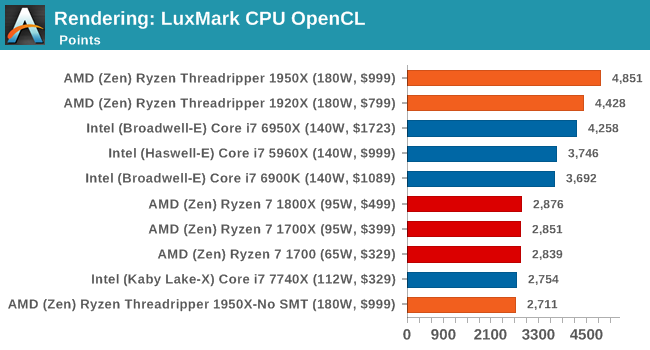
Like Blender, LuxMark is all about the thread count. Ray tracing is very nearly a textbook case for easy multi-threaded scaling. Though it's interesting just how close the 10-core Core i9-7900X gets in the CPU (C++) test despite a significant core count disadvantage, likely due to a combination of higher IPC and clockspeeds.
POV-Ray 3.7.1b4: link
Another regular benchmark in most suites, POV-Ray is another ray-tracer but has been around for many years. It just so happens that during the run up to AMD's Ryzen launch, the code base started to get active again with developers making changes to the code and pushing out updates. Our version and benchmarking started just before that was happening, but given time we will see where the POV-Ray code ends up and adjust in due course.
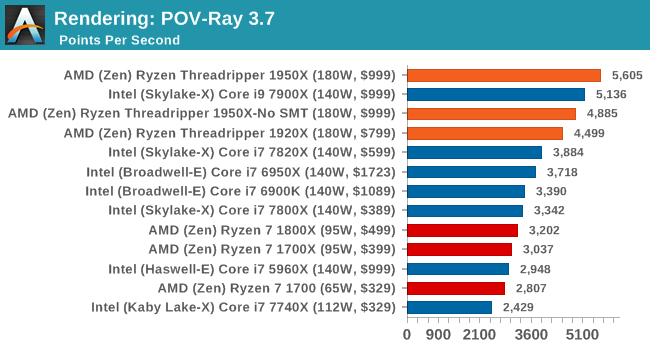
Similar to LuxMark, POV-Ray also wins on account of threads.
Cinebench R15: link
The latest version of CineBench has also become one of those 'used everywhere' benchmarks, particularly as an indicator of single thread performance. High IPC and high frequency gives performance in ST, whereas having good scaling and many cores is where the MT test wins out.
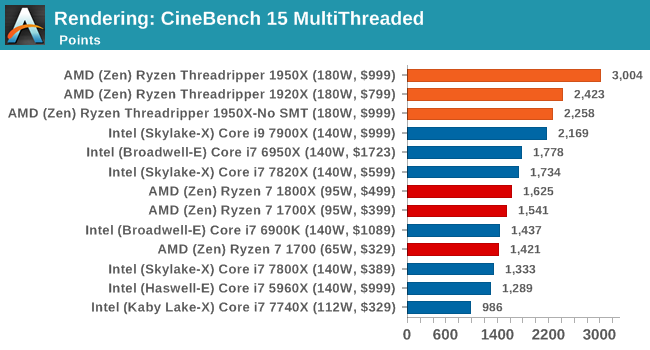
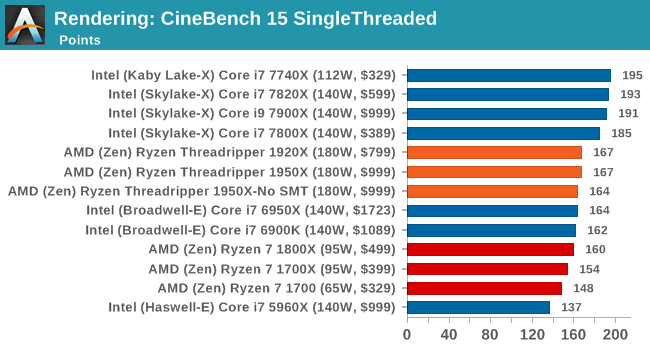
Intel recently announced that its new 18-core chip scores 3200 on Cinebench R15. That would be an extra 6.7% performance over the Threadripper 1950X for 2x the cost.
CPU Web Tests
One of the issues when running web-based tests is the nature of modern browsers to automatically install updates. This means any sustained period of benchmarking will invariably fall foul of the 'it's updated beyond the state of comparison' rule, especially when browsers will update if you give them half a second to think about it. Despite this, we were able to find a series of commands to create an un-updatable version of Chrome 56 for our 2017 test suite. While this means we might not be on the bleeding edge of the latest browser, it makes the scores between CPUs comparable.
All of our benchmark results can also be found in our benchmark engine, Bench.
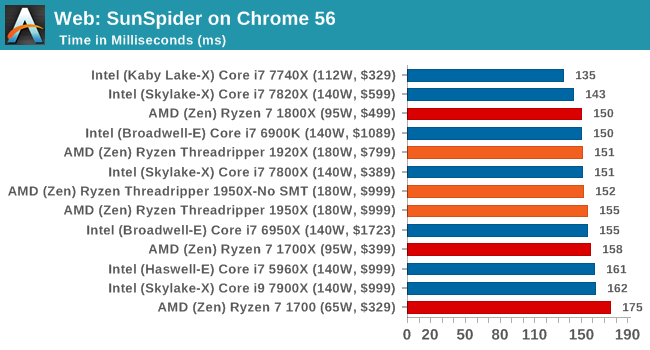
SunSpider 1.0.2: link
The oldest web-based benchmark in this portion of our test is SunSpider. This is a very basic javascript algorithm tool, and ends up being more a measure of IPC and latency than anything else, with most high-performance CPUs scoring around about the same. The basic test is looped 10 times and the average taken. We run the basic test 4 times.
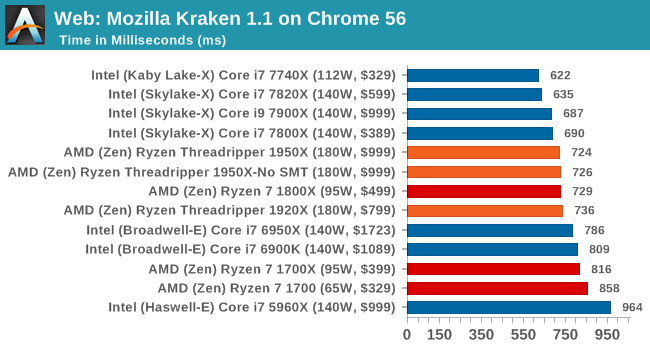
Mozilla Kraken 1.1: link
Kraken is another Javascript based benchmark, using the same test harness as SunSpider, but focusing on more stringent real-world use cases and libraries, such as audio processing and image filters. Again, the basic test is looped ten times, and we run the basic test four times.
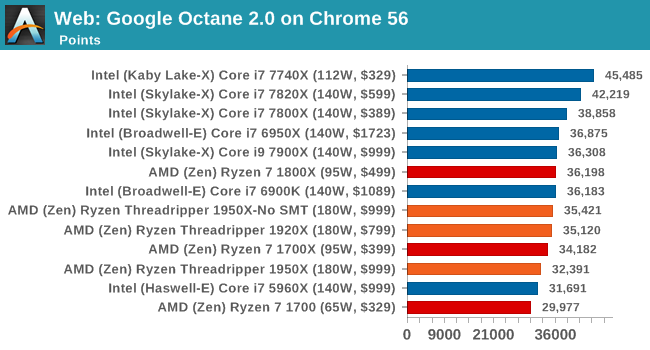
Google Octane 2.0: link
Along with Mozilla, as Google is a major browser developer, having peak JS performance is typically a critical asset when comparing against the other OS developers. In the same way that SunSpider is a very early JS benchmark, and Kraken is a bit newer, Octane aims to be more relevant to real workloads, especially in power constrained devices such as smartphones and tablets.
WebXPRT 2015: link
While the previous three benchmarks do calculations in the background and represent a score, WebXPRT is designed to be a better interpretation of visual workloads that a professional user might have, such as browser based applications, graphing, image editing, sort/analysis, scientific analysis and financial tools.
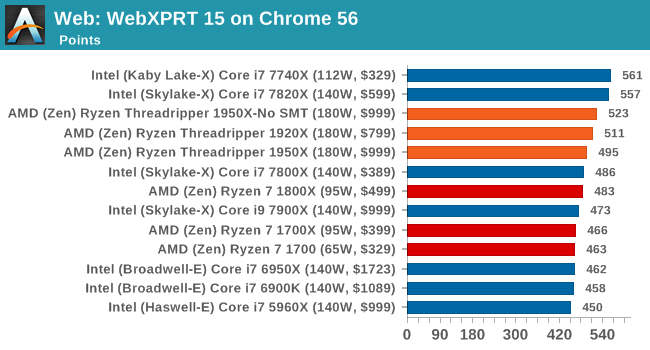
Overall, all of our web benchmarks show a similar trend. Very few web frameworks offer multi-threading – the browsers themselves are barely multi-threaded at times – so Threadripper's vast thread count is underutilized. What wins the day on the web are a handful of fast cores with high single-threaded performance.
CPU Encoding Tests
One of the interesting elements on modern processors is encoding performance. This includes encryption/decryption, as well as video transcoding from one video format to another. In the encrypt/decrypt scenario, this remains pertinent to on-the-fly encryption of sensitive data - a process by which more modern devices are leaning to for software security. Video transcoding as a tool to adjust the quality, file size and resolution of a video file has boomed in recent years, such as providing the optimum video for devices before consumption, or for game streamers who are wanting to upload the output from their video camera in real-time. As we move into live 3D video, this task will only get more strenuous, and it turns out that the performance of certain algorithms is a function of the input/output of the content.
All of our benchmark results can also be found in our benchmark engine, Bench.
7-Zip 9.2: link
One of the freeware compression tools that offers good scaling performance between processors is 7-Zip. It runs under an open-source licence, is fast, and easy to use tool for power users. We run the benchmark mode via the command line for four loops and take the output score.
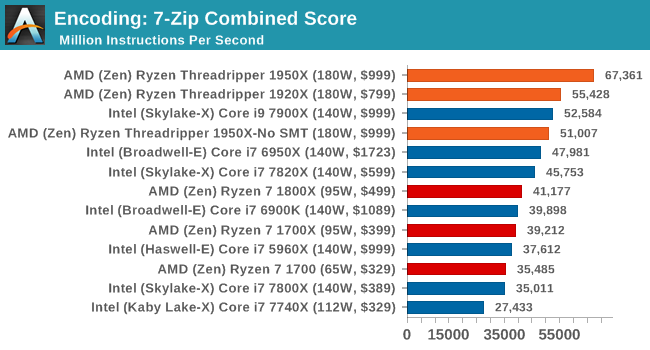
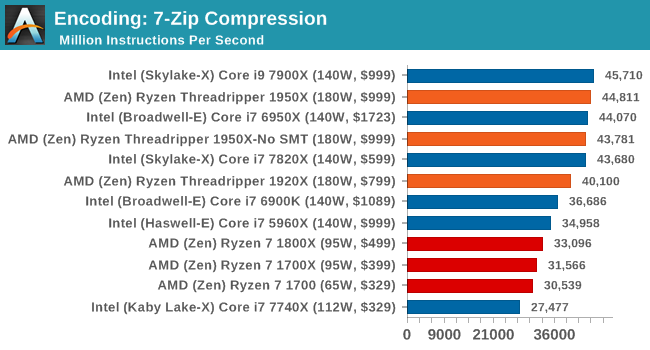
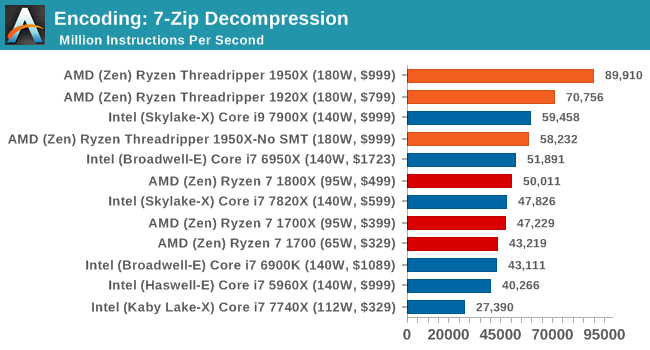
At the request of a few users, we've gone back through our saved benchmark data and pulled out compression/decompression numbers for 7-zip. AMD clearly makes a win here in decompression by a long way.
WinRAR 5.40: link
For the 2017 test suite, we move to the latest version of WinRAR in our compression test. WinRAR in some quarters is more user friendly that 7-Zip, hence its inclusion. Rather than use a benchmark mode as we did with 7-Zip, here we take a set of files representative of a generic stack (33 video files in 1.37 GB, 2834 smaller website files in 370 folders in 150 MB) of compressible and incompressible formats. The results shown are the time taken to encode the file. Due to DRAM caching, we run the test 10 times and take the average of the last five runs when the benchmark is in a steady state.
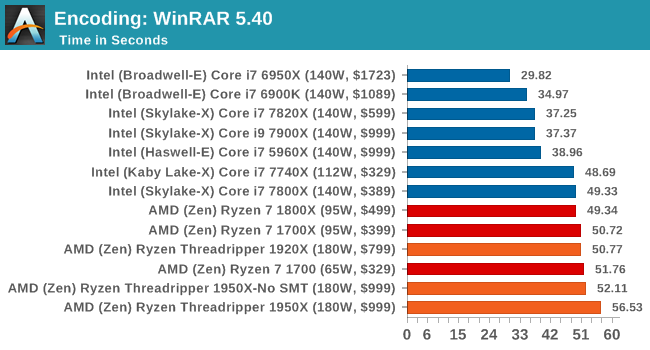
WinRAR encoding is another test that doesn't scale up especially well with thread counts. After only a few threads, most of its MT performance gains have been achieved. Which isn't a help to Threadripper, and is outright a hiderence in Creator Mode.
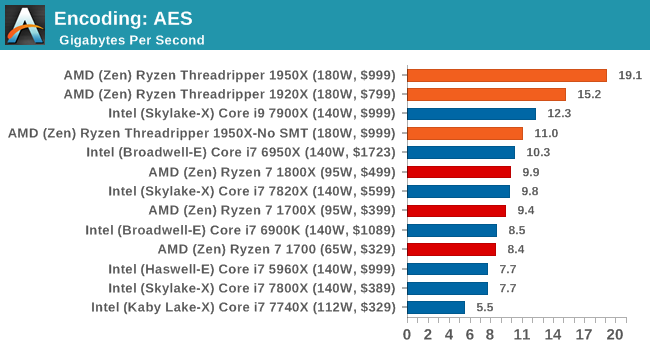
AES Encoding
Algorithms using AES coding have spread far and wide as a ubiquitous tool for encryption. Again, this is another CPU limited test, and modern CPUs have special AES pathways to accelerate their performance. We often see scaling in both frequency and cores with this benchmark. We use the latest version of TrueCrypt and run its benchmark mode over 1GB of in-DRAM data. Results shown are the GB/s average of encryption and decryption.
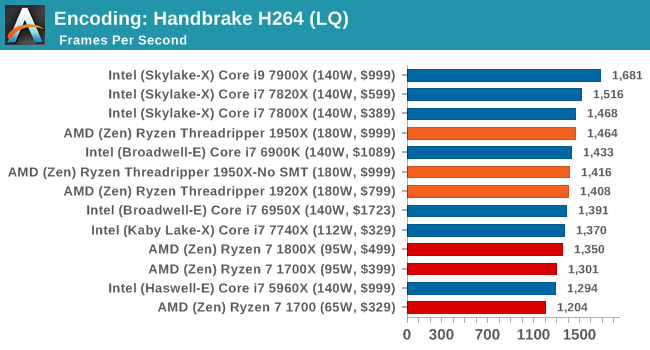
HandBrake v1.0.2 H264 and HEVC: link
As mentioned above, video transcoding (both encode and decode) is a hot topic in performance metrics as more and more content is being created. First consideration is the standard in which the video is encoded, which can be lossless or lossy, trade performance for file-size, trade quality for file-size, or all of the above can increase encoding rates to help accelerate decoding rates. Alongside Google's favorite codec, VP9, there are two others that are taking hold: H264, the older codec, is practically everywhere and is designed to be optimized for 1080p video, and HEVC (or H265) that is aimed to provide the same quality as H264 but at a lower file-size (or better quality for the same size). HEVC is important as 4K is streamed over the air, meaning less bits need to be transferred for the same quality content.
Handbrake is a favored tool for transcoding, and so our test regime takes care of three areas.
Low Quality/Resolution H264: Here we transcode a 640x266 H264 rip of a 2 hour film, and change the encoding from Main profile to High profile, using the very-fast preset.
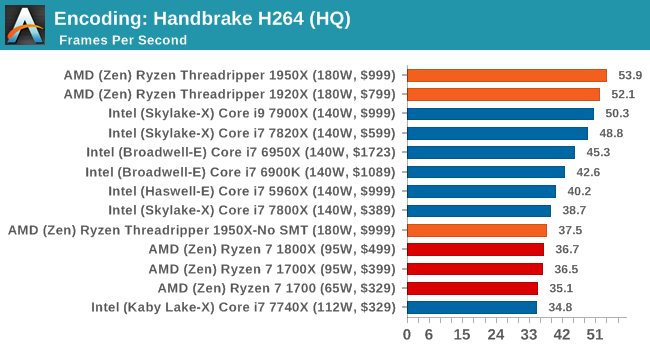
High Quality/Resolution H264: A similar test, but this time we take a ten-minute double 4K (3840x4320) file running at 60 Hz and transcode from Main to High, using the very-fast preset.
HEVC Test: Using the same video in HQ, we change the resolution and codec of the original video from 4K60 in H264 into 4K60 HEVC.
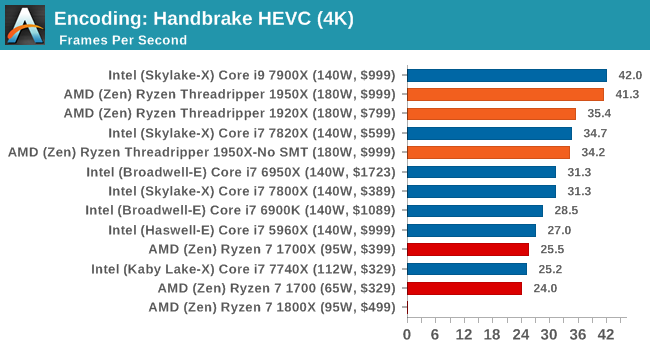
In the HQ H264 test, AMD pushes ahead with both the processors, while SMT-off severely limits the 1950X due to the lack of SMT threads. As we move to HEVC though, the 1950X and 7900X clash on performance.
CPU Office Tests
The office programs we use for benchmarking aren't specific programs per-se, but industry standard tests that hold weight with professionals. The goal of these tests is to use an array of software and techniques that a typical office user might encounter, such as video conferencing, document editing, architectural modeling, and so on and so forth.
All of our benchmark results can also be found in our benchmark engine, Bench.
Chromium Compile (v56)
Our new compilation test uses Windows 10 Pro, VS Community 2015.3 with the Win10 SDK to compile a nightly build of Chromium. We've fixed the test for a build in late March 2017, and we run a fresh full compile in our test. Compilation is the typical example given of a variable threaded workload - some of the compile and linking is linear, whereas other parts are multithreaded.
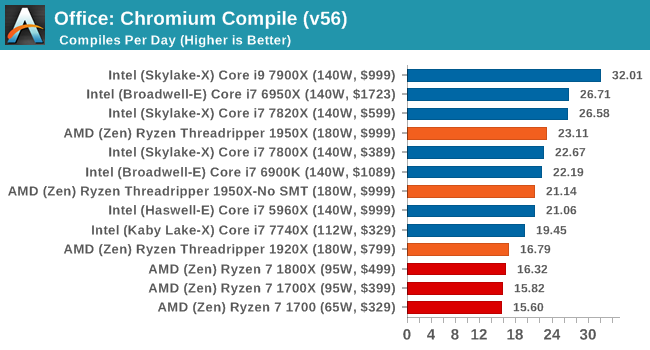
One of the interesting data points in our test is the Compile, and it is surprising to see the 1920X only just beat the Ryzen 7 chips. Because this test requires a lot of cross-core communication, the fewer cores per CCX there are, the worse the result. This is why the 1950X in SMT-off mode beats the 3 cores-per-CCX 1920X, along with lower latency memory support. We know that this test is not too keen on victim caches either, but it does seem that the 2MB per core ratio does well for the 1950X, and could explain the performance difference moving from 8 to 12 to 16 cores under the Zen microarchitecture.
PCMark8: link
Despite originally coming out in 2008/2009, Futuremark has maintained PCMark8 to remain relevant in 2017. On the scale of complicated tasks, PCMark focuses more on the low-to-mid range of professional workloads, making it a good indicator for what people consider 'office' work. We run the benchmark from the commandline in 'conventional' mode, meaning C++ over OpenCL, to remove the graphics card from the equation and focus purely on the CPU. PCMark8 offers Home, Work and Creative workloads, with some software tests shared and others unique to each benchmark set.
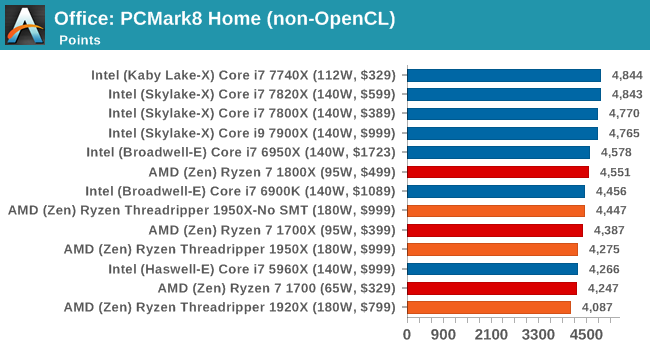
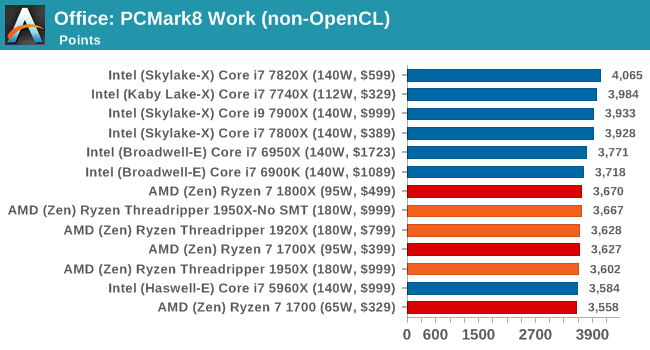
Strangely, PCMark 8's Creative test seems to be failing across the board. We're trying to narrow down the issue.
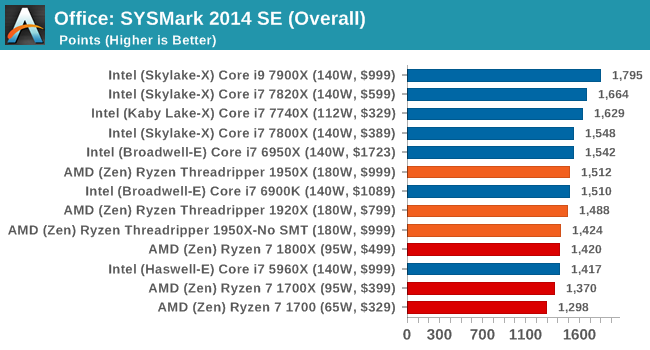
SYSmark 2014 SE: link
SYSmark is developed by Bapco, a consortium of industry CPU companies. The goal of SYSmark is to take stripped down versions of popular software, such as Photoshop and Onenote, and measure how long it takes to process certain tasks within that software. The end result is a score for each of the three segments (Office, Media, Data) as well as an overall score. Here a reference system (Core i3-6100, 4GB DDR3, 256GB SSD, Integrated HD 530 graphics) is used to provide a baseline score of 1000 in each test.
A note on context for these numbers. AMD left Bapco in the last two years, due to differences of opinion on how the benchmarking suites were chosen and AMD believed the tests are angled towards Intel processors and had optimizations to show bigger differences than what AMD felt was present. The following benchmarks are provided as data, but the conflict of opinion between the two companies on the validity of the benchmark is provided as context for the following numbers.
CPU Legacy Tests
Our legacy tests represent benchmarks that were once at the height of their time. Some of these are industry standard synthetics, and we have data going back over 10 years. All of the data here has been rerun on Windows 10, and we plan to go back several generations of components to see how performance has evolved.
All of our benchmark results can also be found in our benchmark engine, Bench.
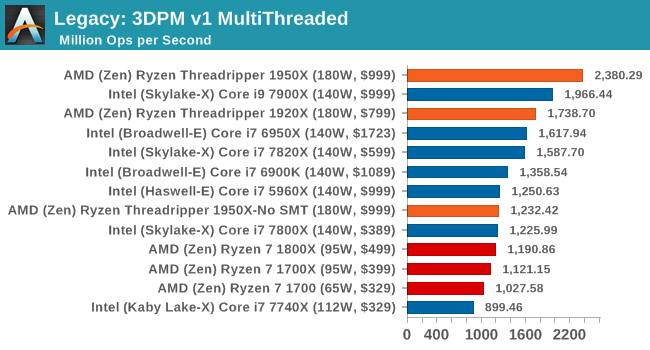
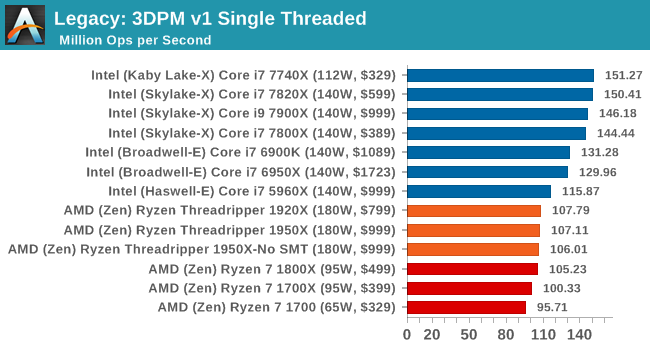
3D Particle Movement v1
3DPM is a self-penned benchmark, taking basic 3D movement algorithms used in Brownian Motion simulations and testing them for speed. High floating point performance, MHz and IPC wins in the single thread version, whereas the multithread version has to handle the threads and loves more cores. This is the original version, written in the style of a typical non-computer science student coding up an algorithm for their theoretical problem, and comes without any non-obvious optimizations not already performed by the compiler, such as false sharing.
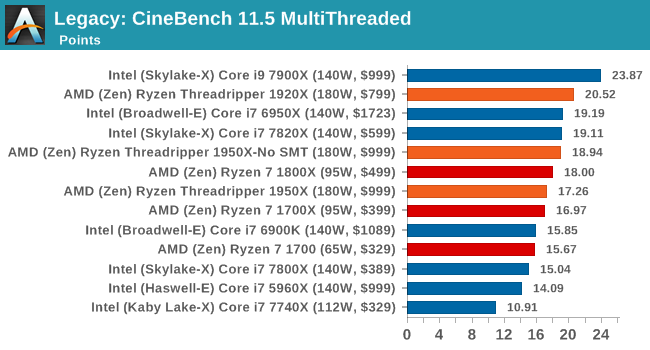
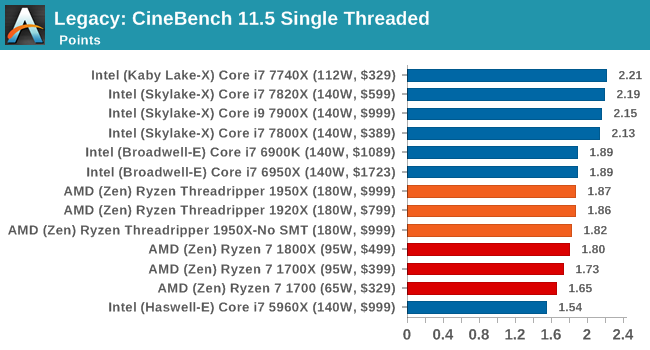
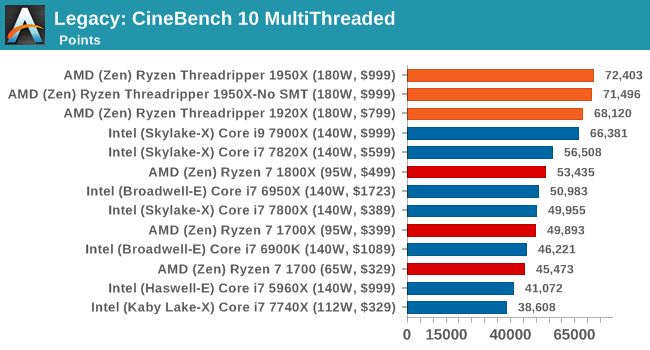
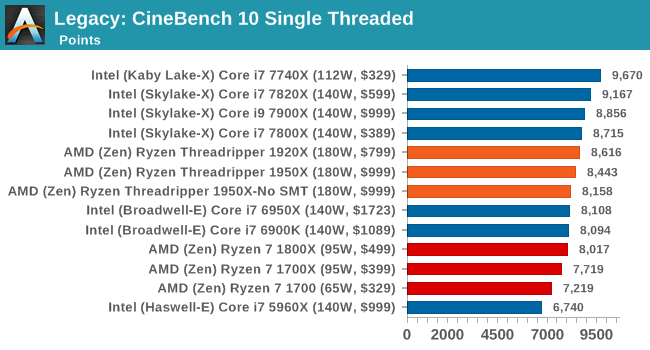
CineBench 11.5 and 10
Cinebench is a widely known benchmarking tool for measuring performance relative to MAXON's animation software Cinema 4D. Cinebench has been optimized over a decade and focuses on purely CPU horsepower, meaning if there is a discrepancy in pure throughput characteristics, Cinebench is likely to show that discrepancy. Arguably other software doesn't make use of all the tools available, so the real world relevance might purely be academic, but given our large database of data for Cinebench it seems difficult to ignore a small five minute test. We run the modern version 15 in this test, as well as the older 11.5 and 10 due to our back data.
x264 HD 3.0
Similarly, the x264 HD 3.0 package we use here is also kept for historic regressional data. The latest version is 5.0.1, and encodes a 1080p video clip into a high-quality x264 file. Version 3.0 only performs the same test on a 720p file, and in most circumstances the software performance hits its limit on high-end processors, but still works well for mainstream and low-end. Also, this version only takes a few minutes, whereas the latest can take over 90 minutes to run.
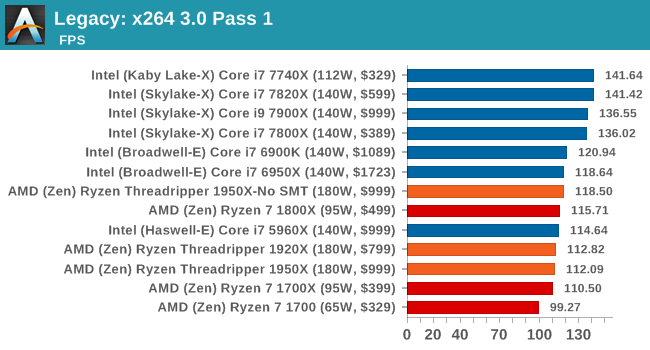
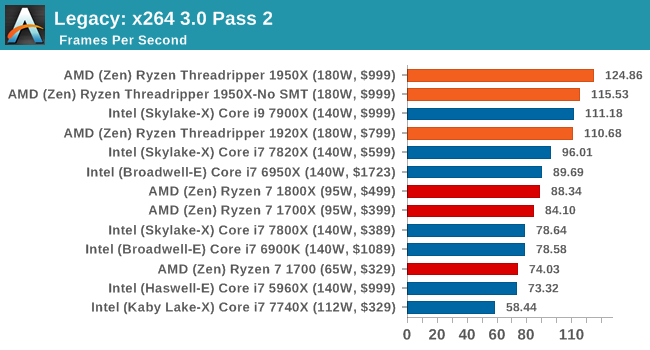
The 1950X: the first CPU to score higher on the 2nd pass of this test than it does on the first pass.
Civilization 6
First up in our CPU gaming tests is Civilization 6. Originally penned by Sid Meier and his team, the Civ series of turn-based strategy games are a cult classic, and many an excuse for an all-nighter trying to get Gandhi to declare war on you due to an integer overflow. Truth be told I never actually played the first version, but every edition from the second to the sixth, including the fourth as voiced by the late Leonard Nimoy, it a game that is easy to pick up, but hard to master.

Benchmarking Civilization has always been somewhat of an oxymoron – for a turn based strategy game, the frame rate is not necessarily the important thing here and even in the right mood, something as low as 5 frames per second can be enough. With Civilization 6 however, Firaxis went hardcore on visual fidelity, trying to pull you into the game. As a result, Civilization can taxing on graphics and CPUs as we crank up the details, especially in DirectX 12.
Perhaps a more poignant benchmark would be during the late game, when in the older versions of Civilization it could take 20 minutes to cycle around the AI players before the human regained control. The new version of Civilization has an integrated ‘AI Benchmark’, although it is not currently part of our benchmark portfolio yet, due to technical reasons which we are trying to solve. Instead, we run the graphics test, which provides an example of a mid-game setup at our settings.
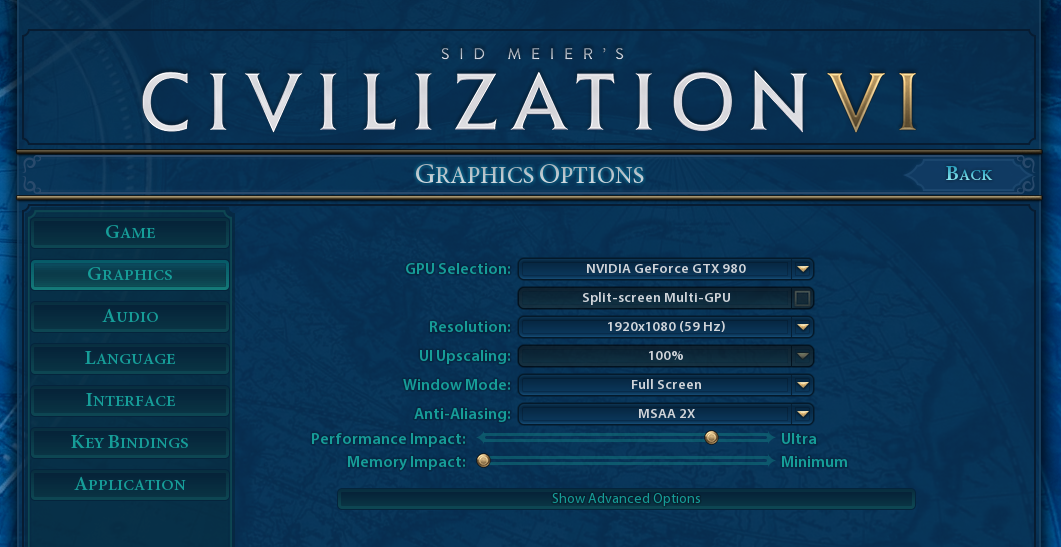
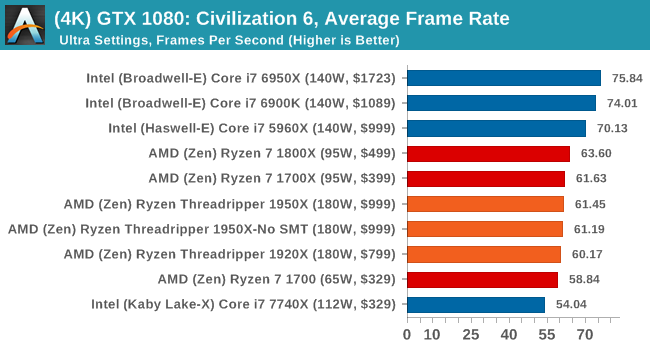
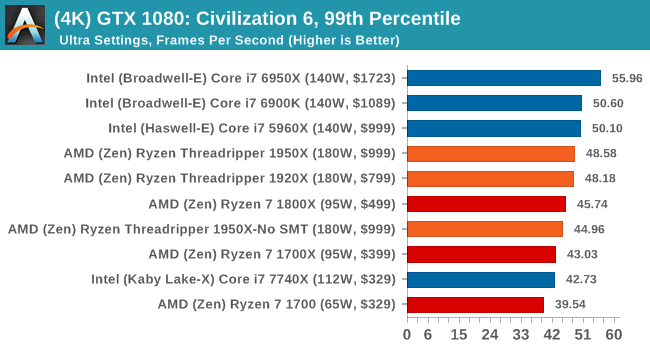
At both 1920x1080 and 4K resolutions, we run the same settings. Civilization 6 has sliders for MSAA, Performance Impact and Memory Impact. The latter two refer to detail and texture size respectively, and are rated between 0 (lowest) to 5 (extreme). We run our Civ6 benchmark in position four for performance (ultra) and 0 on memory, with MSAA set to 2x.
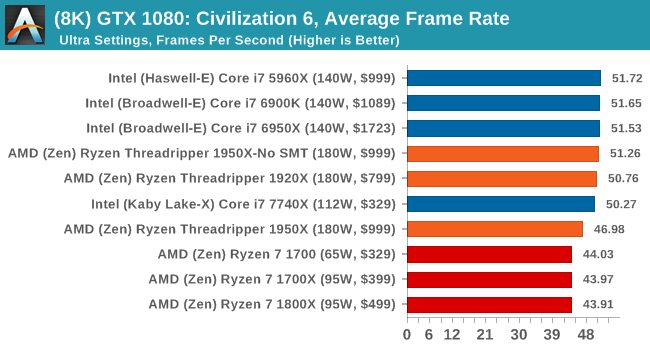
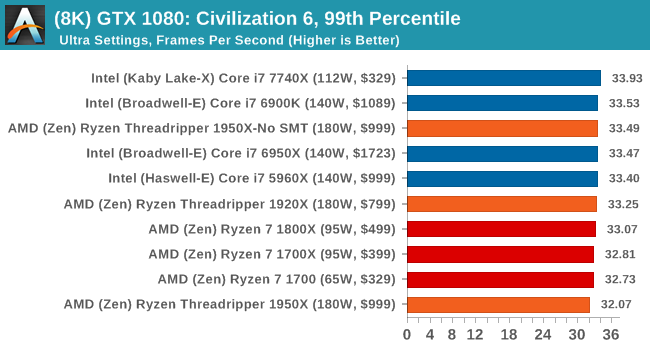
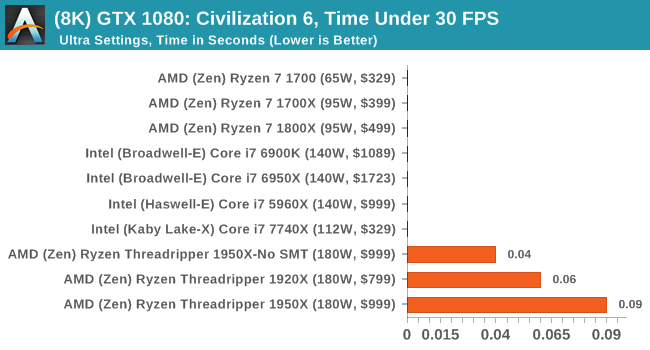
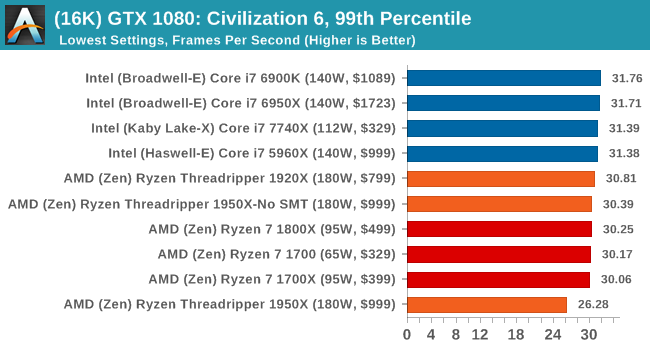
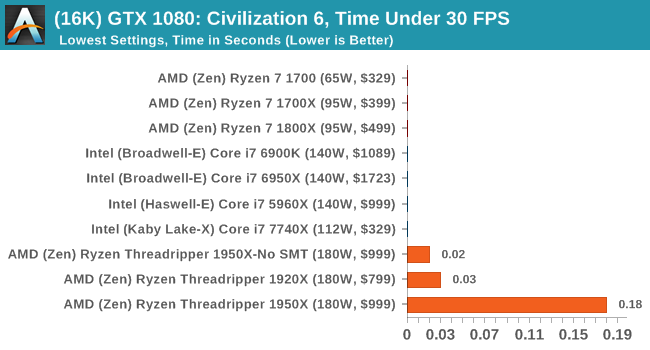
For reviews where we include 8K and 16K benchmarks (Civ6 allows us to benchmark extreme resolutions on any monitor) on our GTX 1080, we run the 8K tests similar to the 4K tests, but the 16K tests are set to the lowest option for Performance.
All of our benchmark results can also be found in our benchmark engine, Bench.
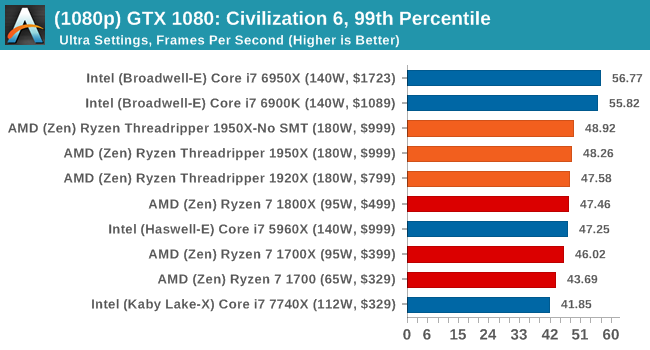
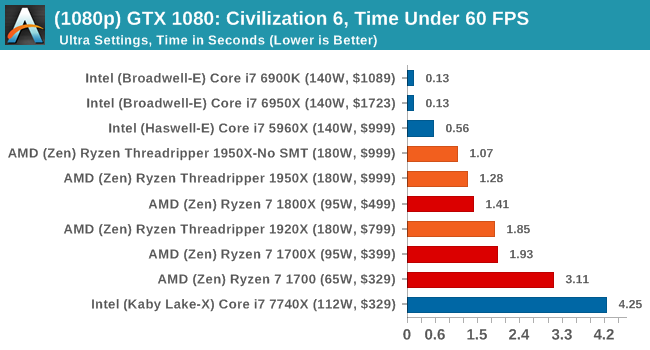
MSI GTX 1080 Gaming 8G Performance
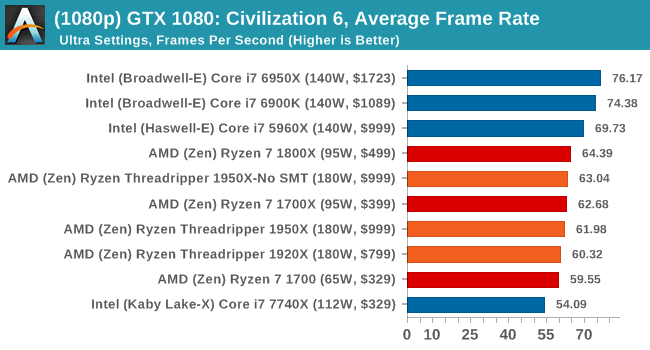
1080p
4K
8K
16K

ASUS GTX 1060 Strix 6G Performance
1080p
4K
Sapphire Nitro R9 Fury 4G Performance
1080p
4K

Sapphire Nitro RX 480 8G Performance
1080p
4K
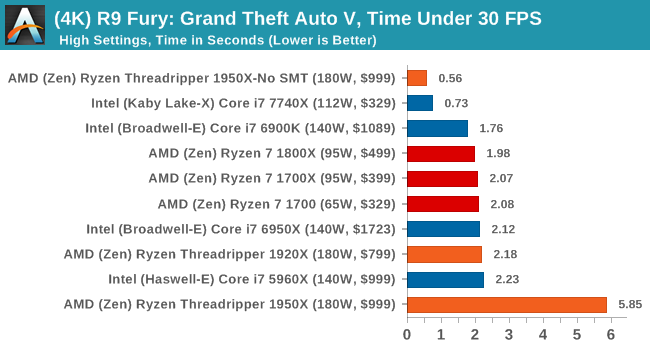
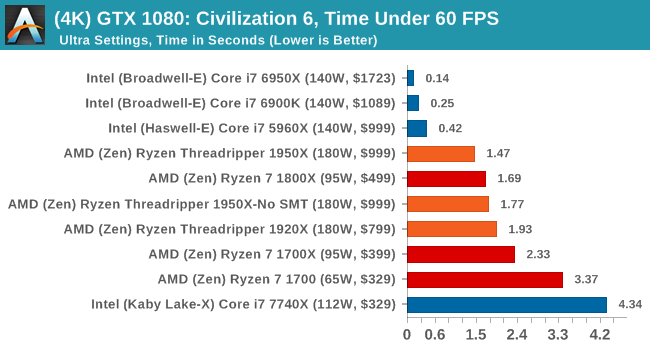
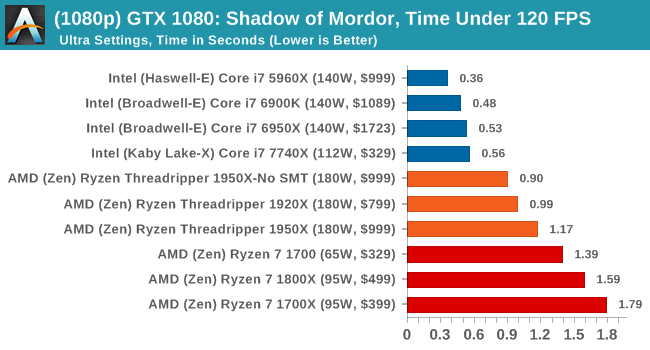
On the whole, the Threadripper CPUs perform as well as Ryzen does on most of the tests, although the Time Under analysis always seems to look worse for Threadripper.
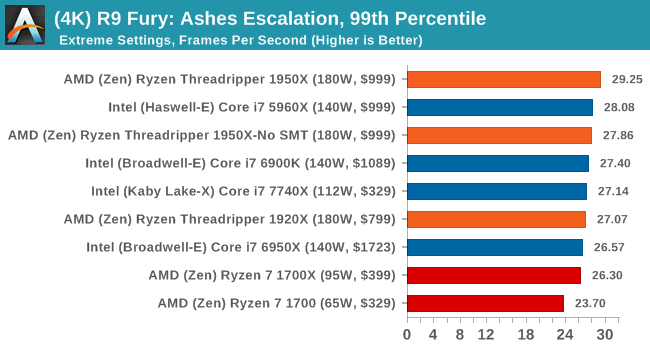
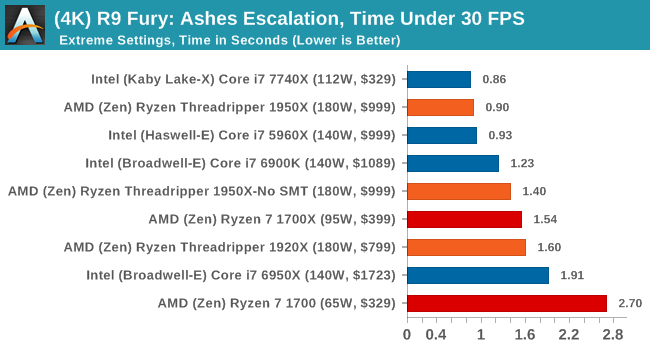
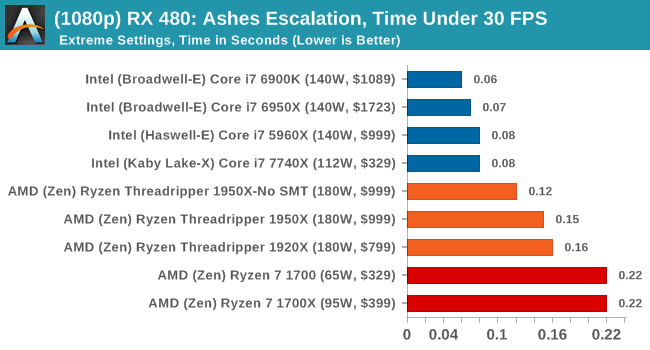
Ashes of the Singularity Escalation
Seen as the holy child of DirectX12, Ashes of the Singularity (AoTS, or just Ashes) has been the first title to actively go explore as many of DirectX12s features as it possibly can. Stardock, the developer behind the Nitrous engine which powers the game, has ensured that the real-time strategy title takes advantage of multiple cores and multiple graphics cards, in as many configurations as possible.

As a real-time strategy title, Ashes is all about responsiveness during both wide open shots but also concentrated battles. With DirectX12 at the helm, the ability to implement more draw calls per second allows the engine to work with substantial unit depth and effects that other RTS titles had to rely on combined draw calls to achieve, making some combined unit structures ultimately very rigid.
Stardock clearly understand the importance of an in-game benchmark, ensuring that such a tool was available and capable from day one, especially with all the additional DX12 features used and being able to characterize how they affected the title for the developer was important. The in-game benchmark performs a four minute fixed seed battle environment with a variety of shots, and outputs a vast amount of data to analyze.
For our benchmark, we run a fixed v2.11 version of the game due to some peculiarities of the splash screen added after the merger with the standalone Escalation expansion, and have an automated tool to call the benchmark on the command line. (Prior to v2.11, the benchmark also supported 8K/16K testing, however v2.11 has odd behavior which nukes this.)
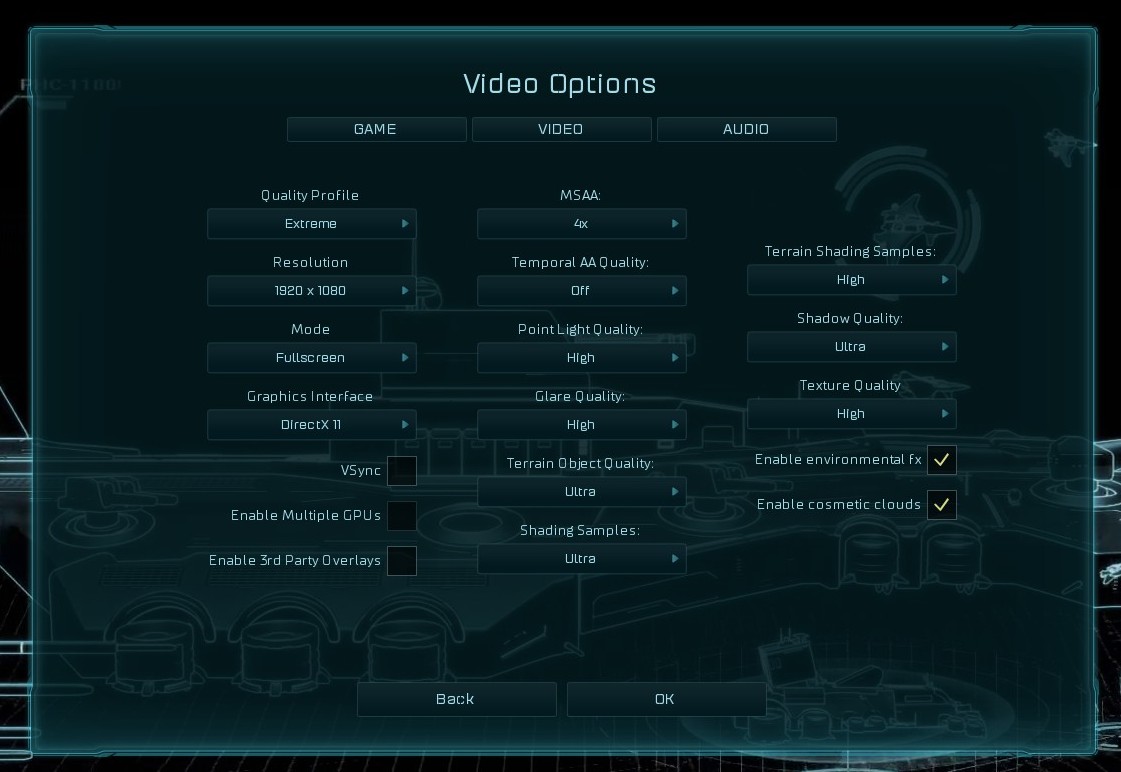
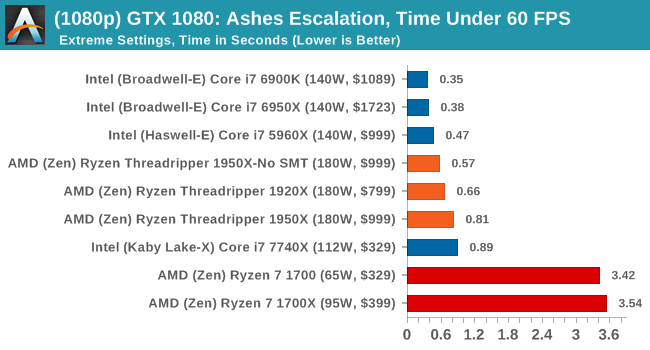
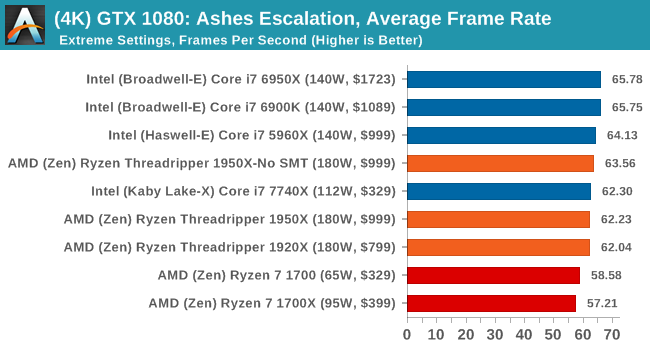
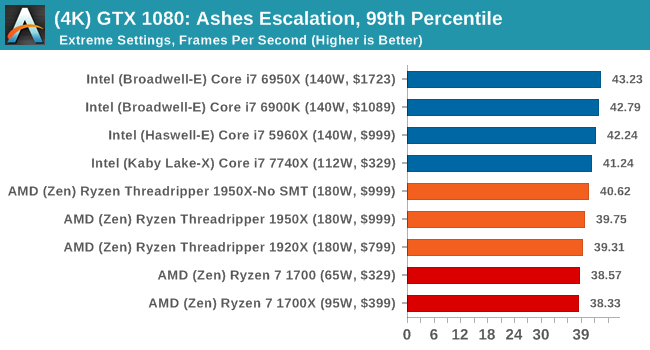
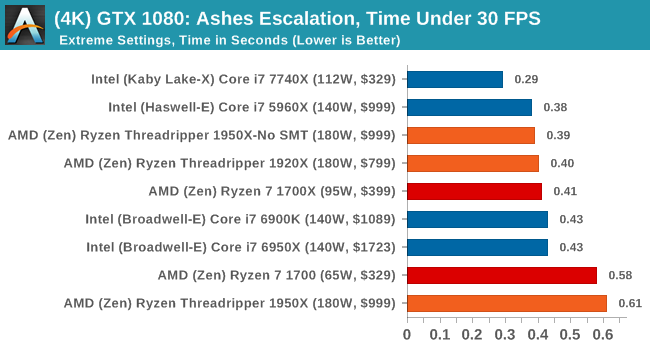
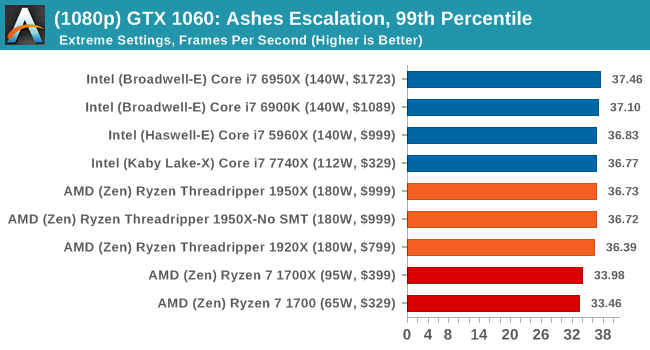
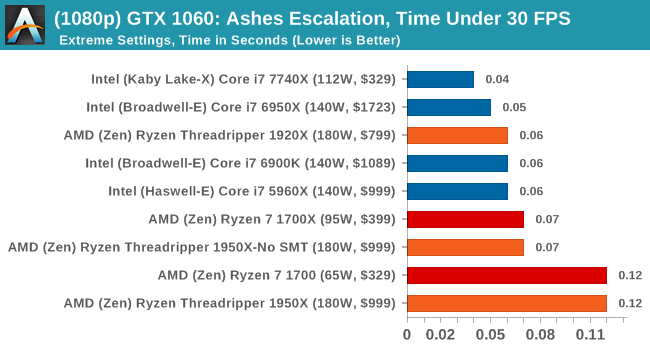
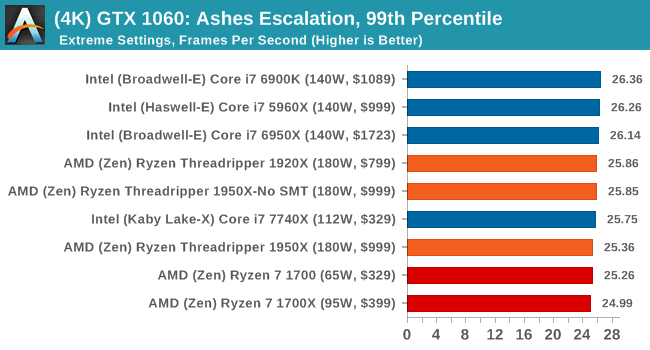
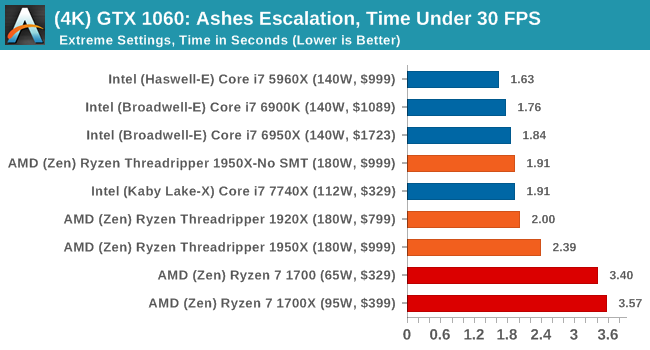
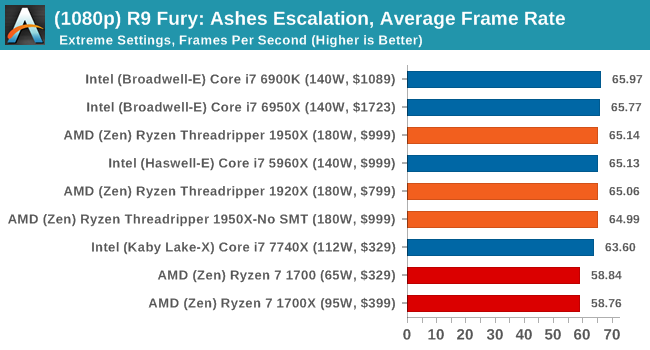
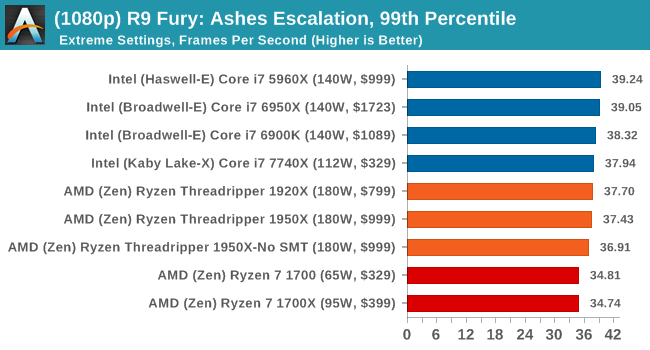
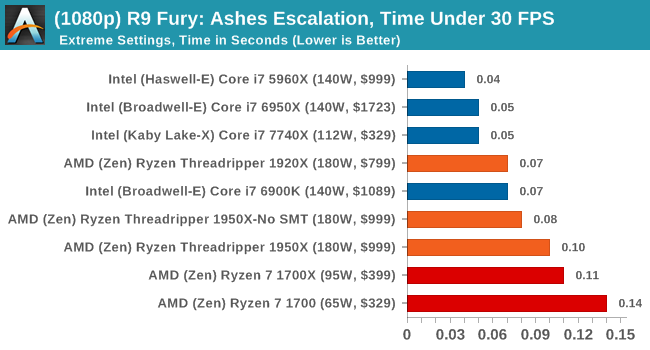
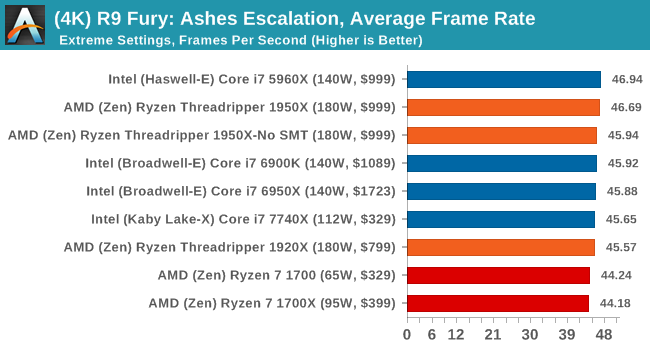
At both 1920x1080 and 4K resolutions, we run the same settings. Ashes has dropdown options for MSAA, Light Quality, Object Quality, Shading Samples, Shadow Quality, Textures, and separate options for the terrain. There are several presents, from Very Low to Extreme: we run our benchmarks at Extreme settings, and take the frame-time output for our average, percentile, and time under analysis.
All of our benchmark results can also be found in our benchmark engine, Bench.
MSI GTX 1080 Gaming 8G Performance
1080p
4K
ASUS GTX 1060 Strix 6G Performance

1080p
4K

Sapphire Nitro R9 Fury 4G Performance
1080p
4K
Sapphire Nitro RX 480 8G Performance
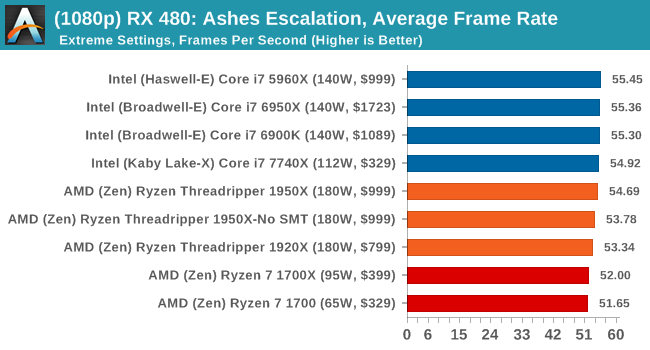
1080p
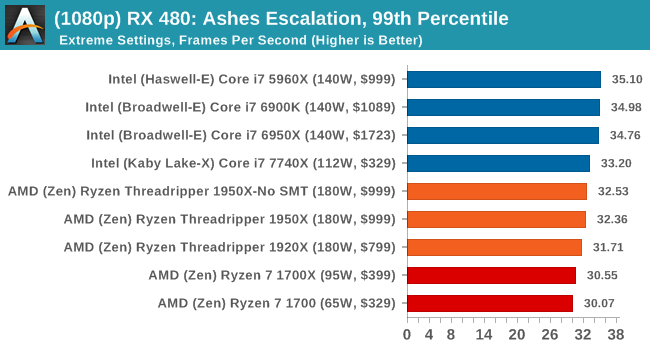
4K
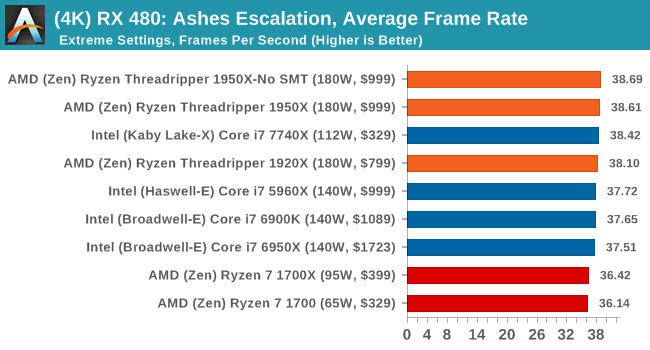
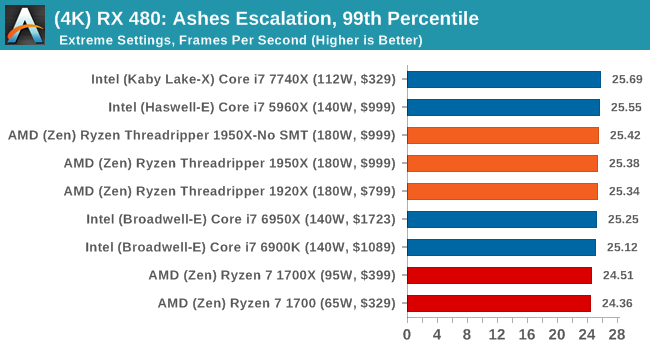
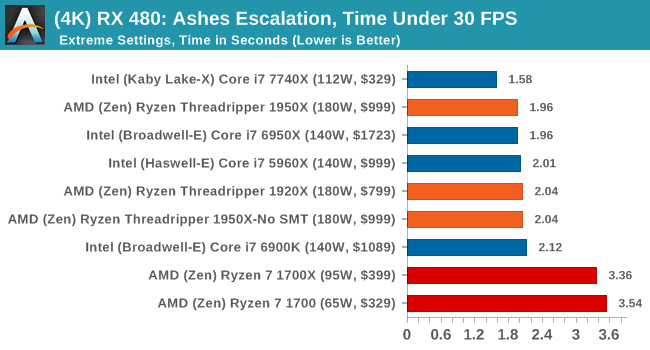
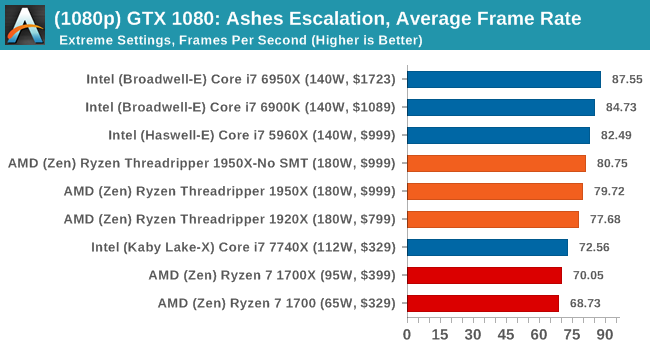
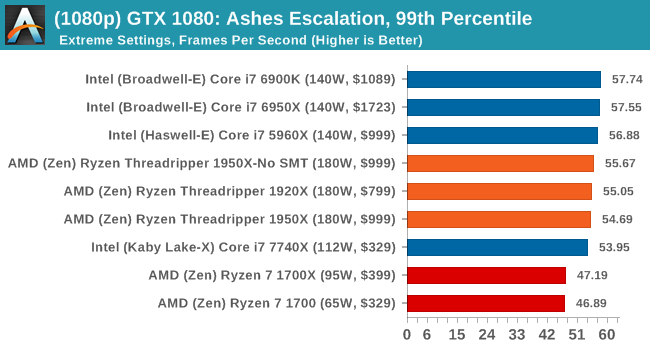
AMD gets in the mix a lot with these tests, and in a number of cases pulls ahead of the Ryzen chips in the Time Under analysis.
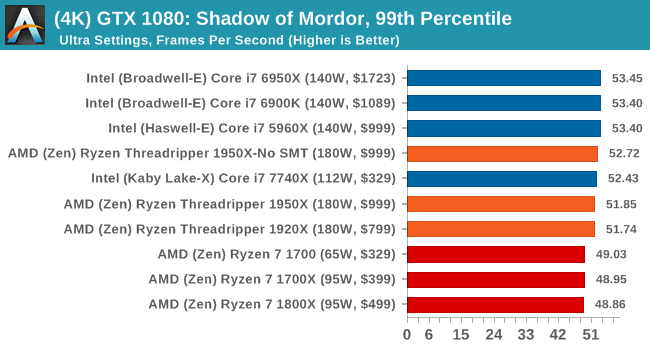
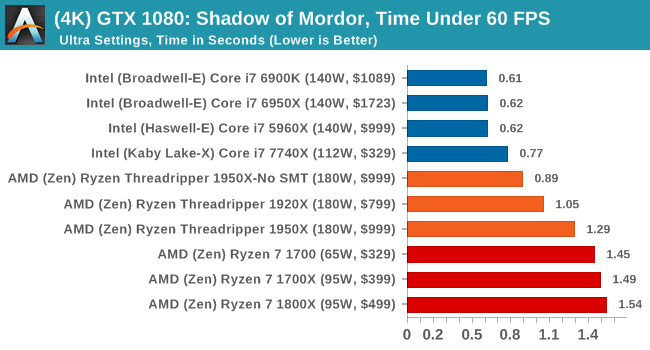
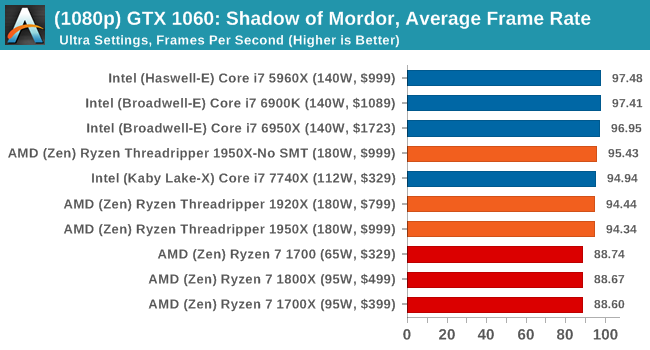
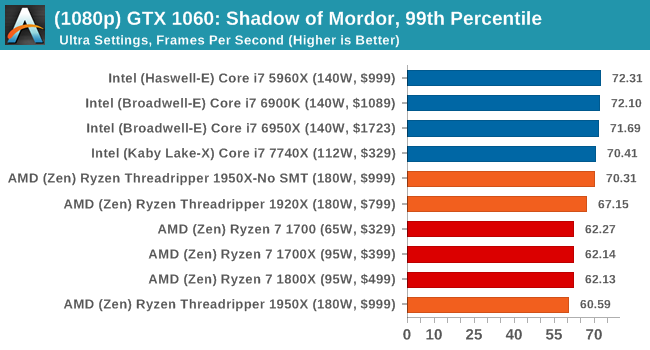
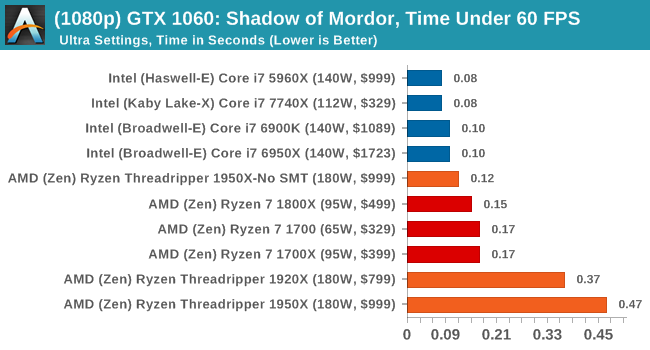
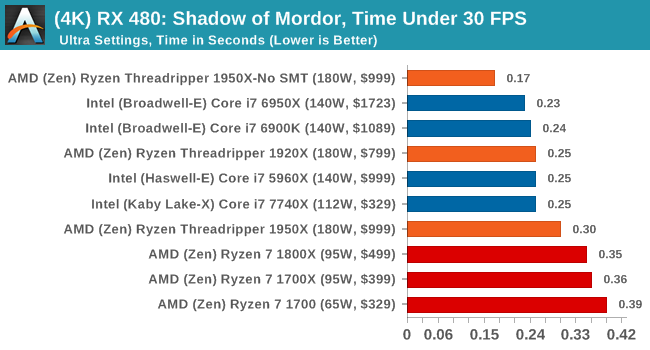
Shadow of Mordor
The next title in our testing is a battle of system performance with the open world action-adventure title, Middle Earth: Shadow of Mordor (SoM for short). Produced by Monolith and using the LithTech Jupiter EX engine and numerous detail add-ons, SoM goes for detail and complexity. The main story itself was written by the same writer as Red Dead Redemption, and it received Zero Punctuation’s Game of The Year in 2014.

A 2014 game is fairly old to be testing now, however SoM has a stable code and player base, and can still stress a PC down to the ones and zeroes. At the time, SoM was unique, offering a dynamic screen resolution setting allowing users to render at high resolutions that are then scaled down to the monitor. This form of natural oversampling was designed to let the user experience a truer vision of what the developers wanted, assuming you had the graphics hardware to power it but had a sub-4K monitor.
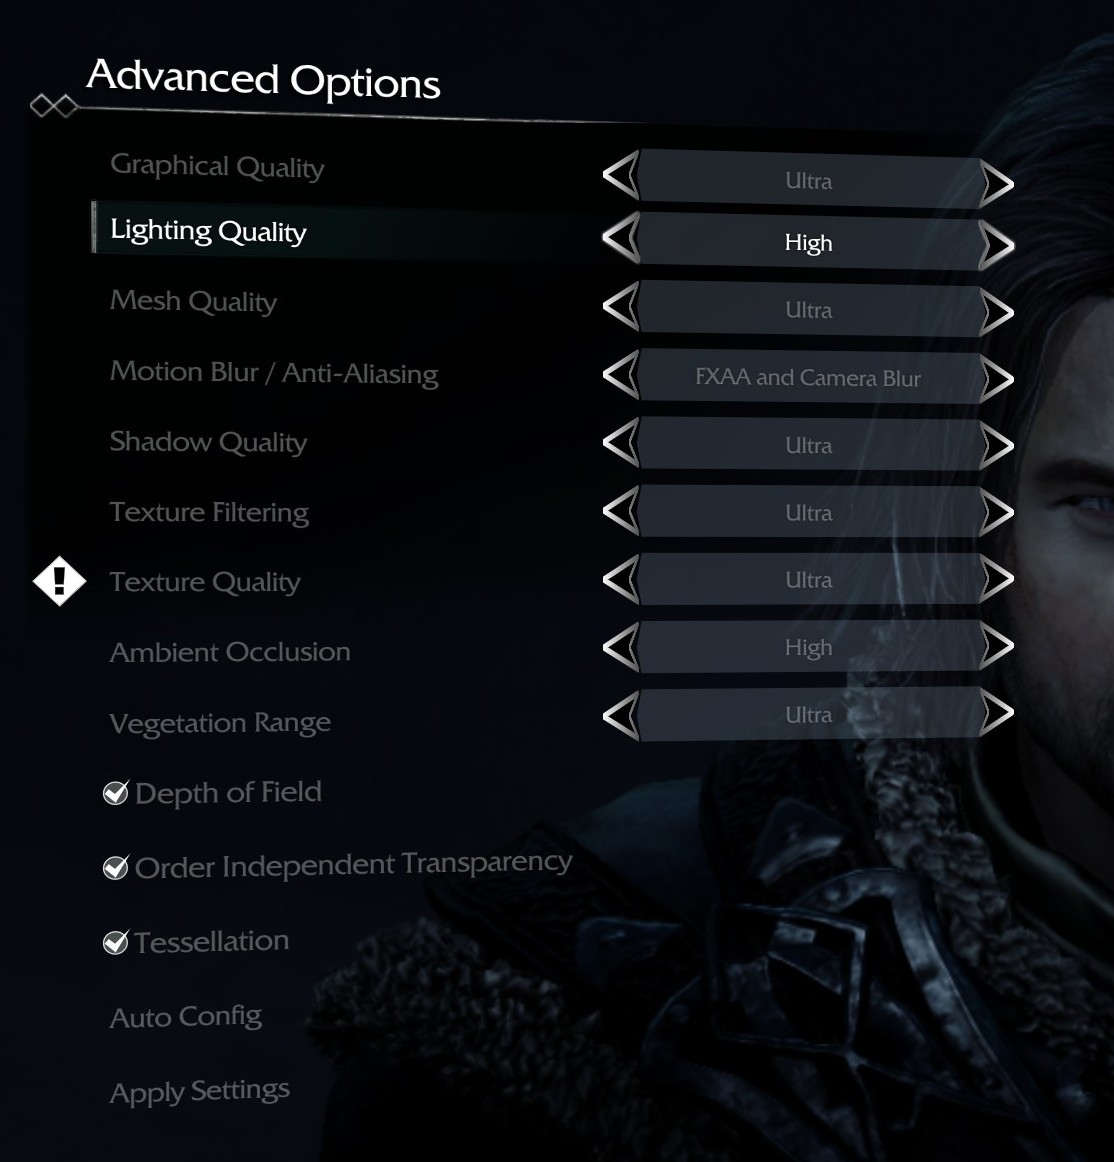
The title has an in-game benchmark, for which we run with an automated script implement the graphics settings, select the benchmark, and parse the frame-time output which is dumped on the drive. The graphics settings include standard options such as Graphical Quality, Lighting, Mesh, Motion Blur, Shadow Quality, Textures, Vegetation Range, Depth of Field, Transparency and Tessellation. There are standard presets as well.
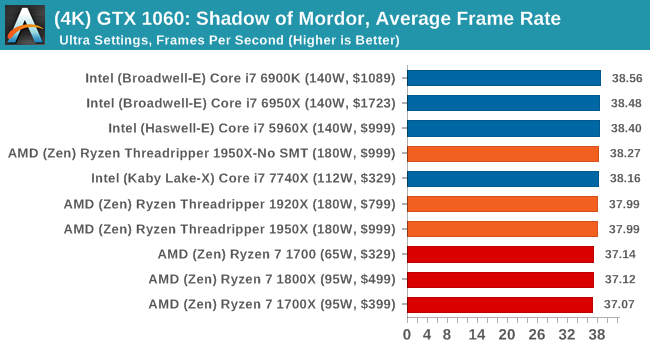
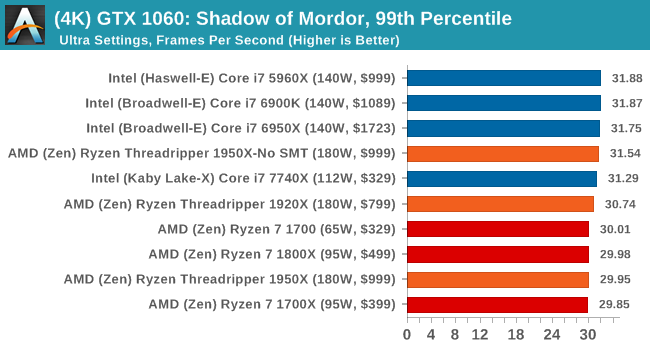
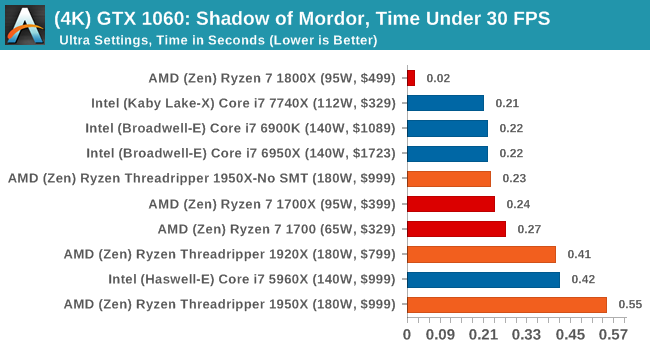
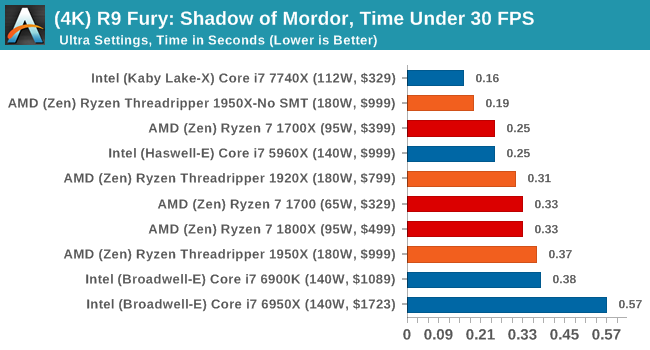
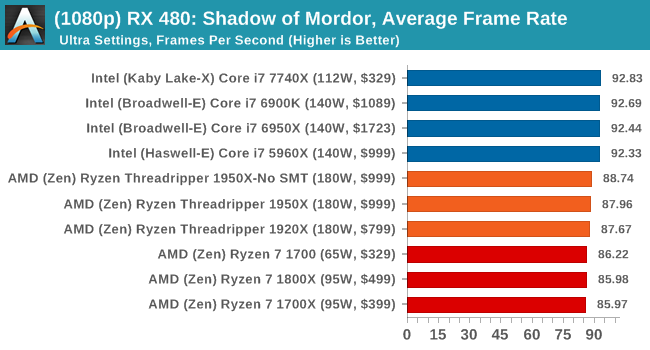
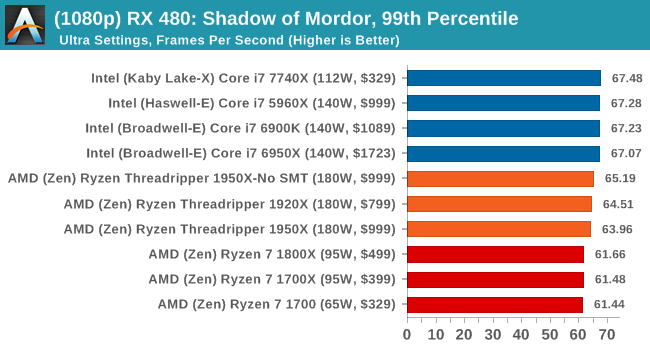
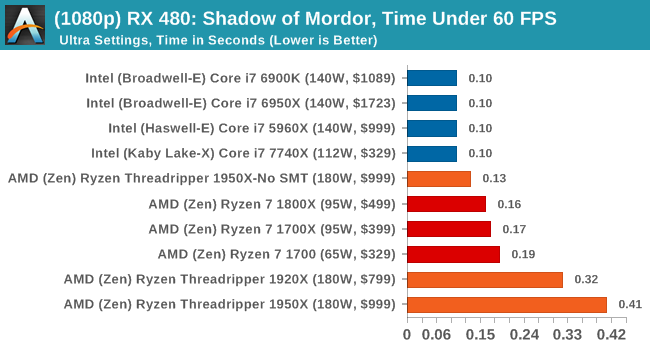
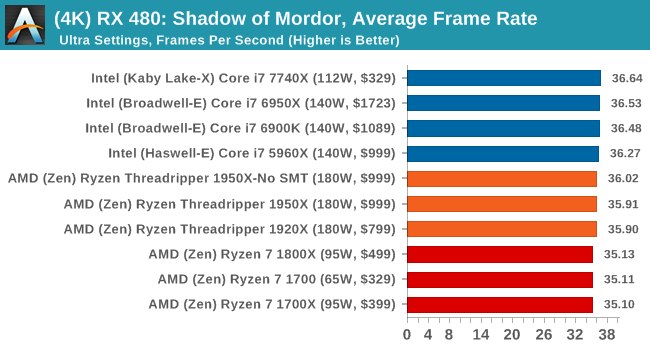
We run the benchmark at 1080p and a native 4K, using our 4K monitors, at the Ultra preset. Results are averaged across four runs and we report the average frame rate, 99th percentile frame rate, and time under analysis.
All of our benchmark results can also be found in our benchmark engine, Bench.
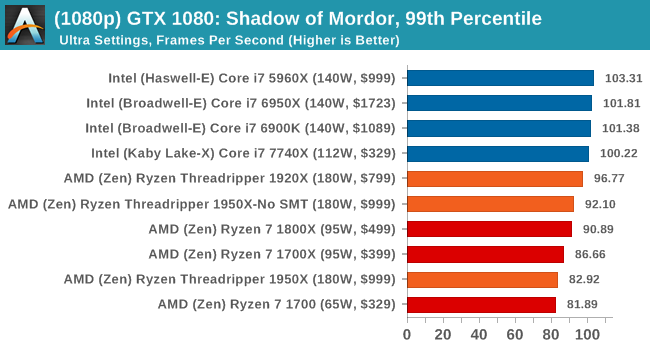
MSI GTX 1080 Gaming 8G Performance
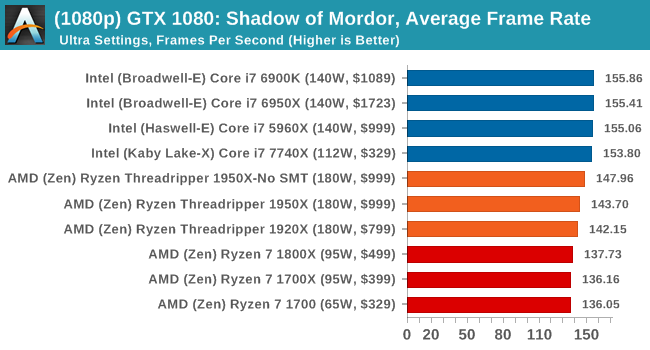
1080p
4K

ASUS GTX 1060 Strix 6G Performance
1080p
4K
Sapphire Nitro R9 Fury 4G Performance
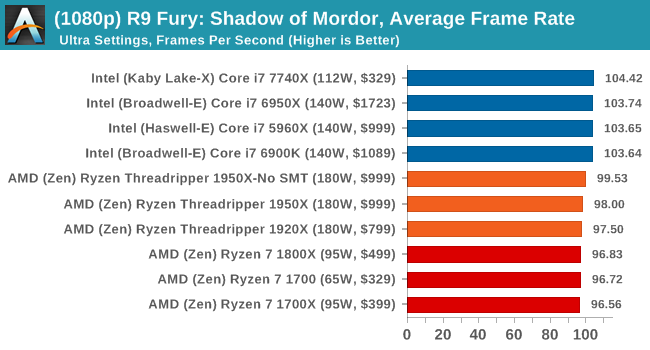
1080p
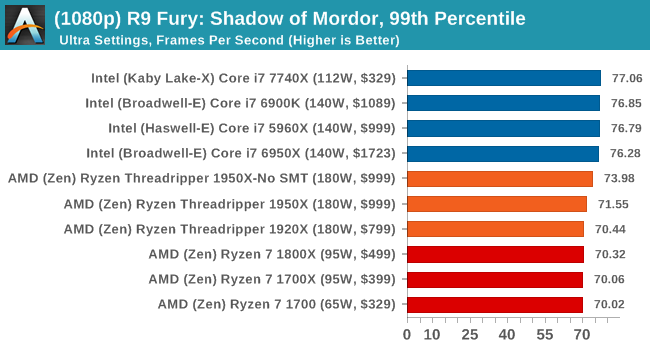
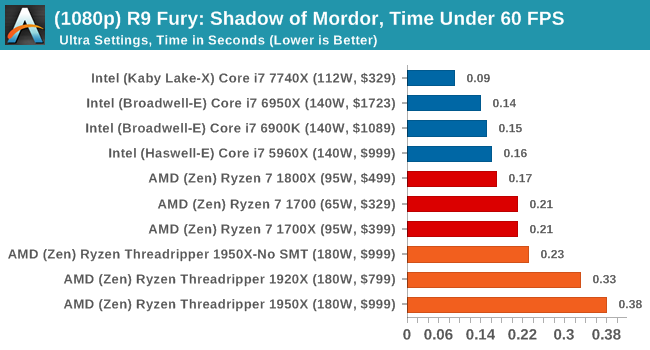
4K


Sapphire Nitro RX 480 8G Performance
1080p
4K

Rise of the Tomb Raider (1080p, 4K)
One of the newest games in the gaming benchmark suite is Rise of the Tomb Raider (RoTR), developed by Crystal Dynamics, and the sequel to the popular Tomb Raider which was loved for its automated benchmark mode. But don’t let that fool you: the benchmark mode in RoTR is very much different this time around.
Visually, the previous Tomb Raider pushed realism to the limits with features such as TressFX, and the new RoTR goes one stage further when it comes to graphics fidelity. This leads to an interesting set of requirements in hardware: some sections of the game are typically GPU limited, whereas others with a lot of long-range physics can be CPU limited, depending on how the driver can translate the DirectX 12 workload.

Where the old game had one benchmark scene, the new game has three different scenes with different requirements: Spine of the Mountain (1-Valley), Prophet’s Tomb (2-Prophet) and Geothermal Valley (3-Mountain) - and we test all three (and yes, I need to relabel them - I got them wrong when I set up the tests). These are three scenes designed to be taken from the game, but it has been noted that scenes like 2-Prophet shown in the benchmark can be the most CPU limited elements of that entire level, and the scene shown is only a small portion of that level. Because of this, we report the results for each scene on each graphics card separately.
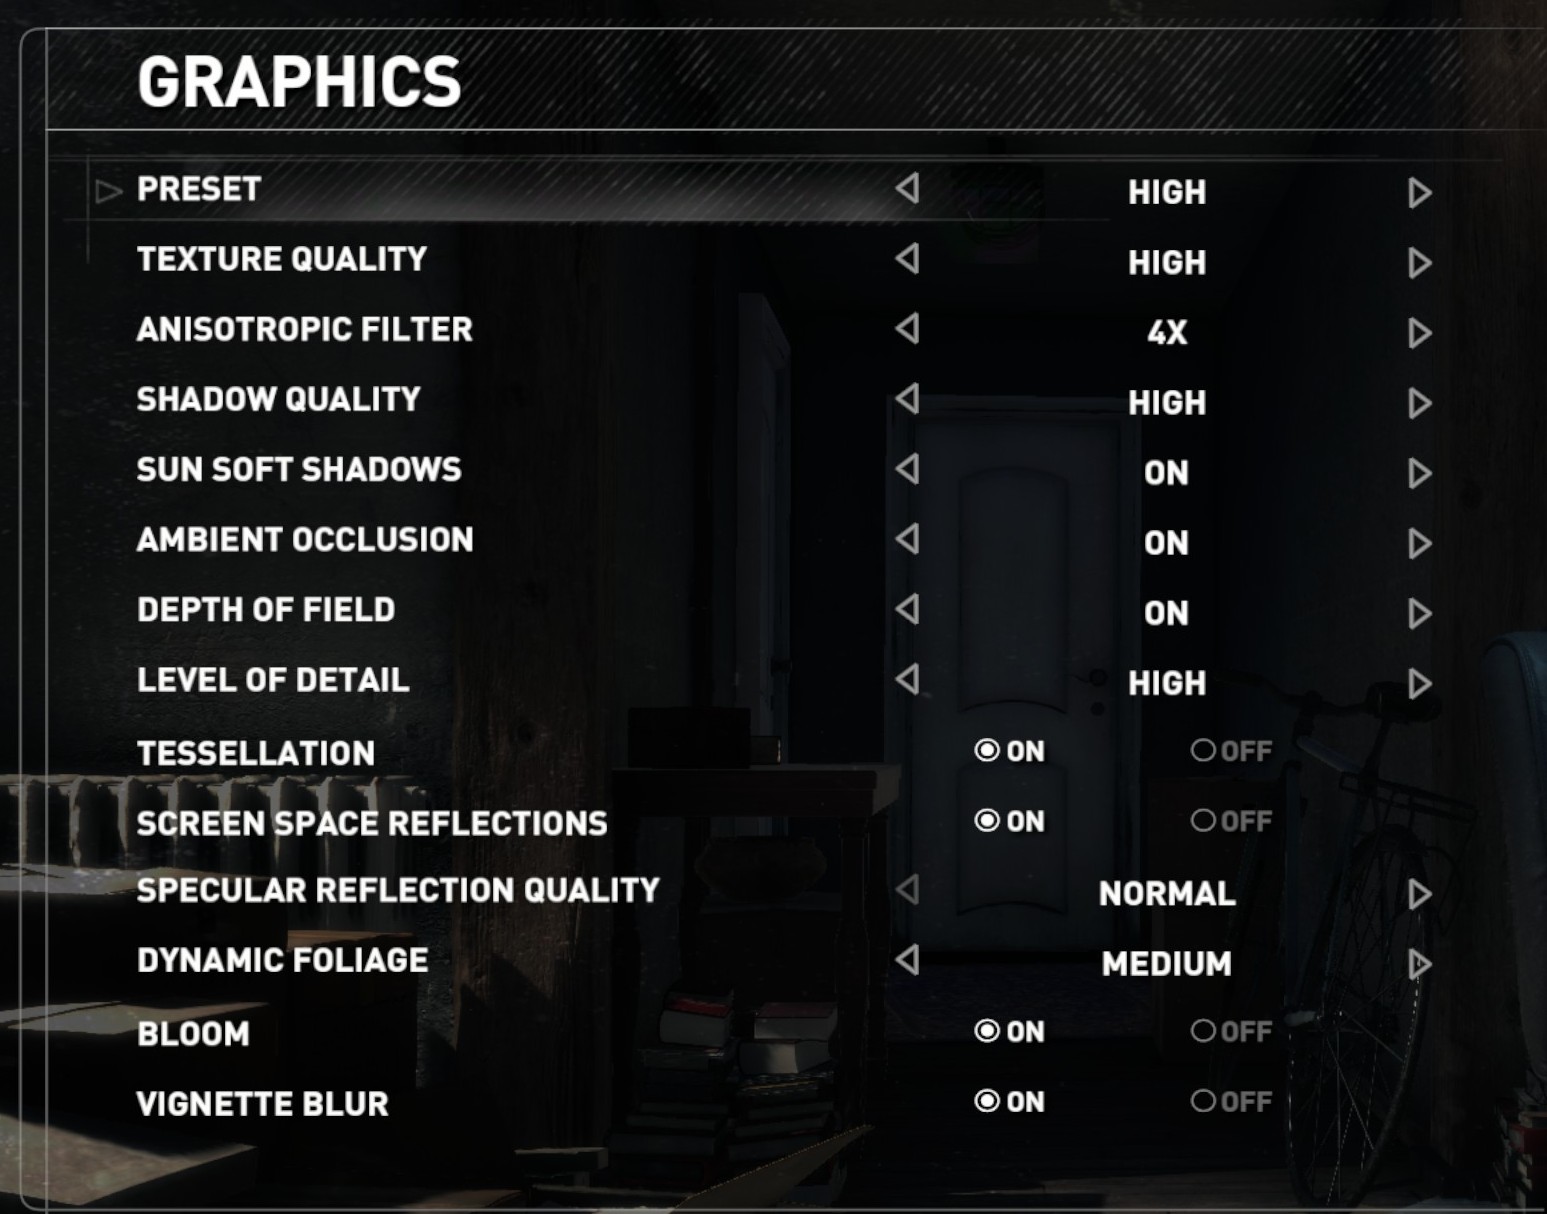
Graphics options for RoTR are similar to other games in this type, offering some presets or allowing the user to configure texture quality, anisotropic filter levels, shadow quality, soft shadows, occlusion, depth of field, tessellation, reflections, foliage, bloom, and features like PureHair which updates on TressFX in the previous game.
Again, we test at 1920x1080 and 4K using our native 4K displays. At 1080p we run the High preset, while at 4K we use the Medium preset which still takes a sizable hit in frame rate.
It is worth noting that RoTR is a little different to our other benchmarks in that it keeps its graphics settings in the registry rather than a standard ini file, and unlike the previous TR game the benchmark cannot be called from the command-line. Nonetheless we scripted around these issues to automate the benchmark four times and parse the results. From the frame time data, we report the averages, 99th percentiles, and our time under analysis.
All of our benchmark results can also be found in our benchmark engine, Bench.
#1 Geothermal Valley Spine of the Mountain

MSI GTX 1080 Gaming 8G Performance
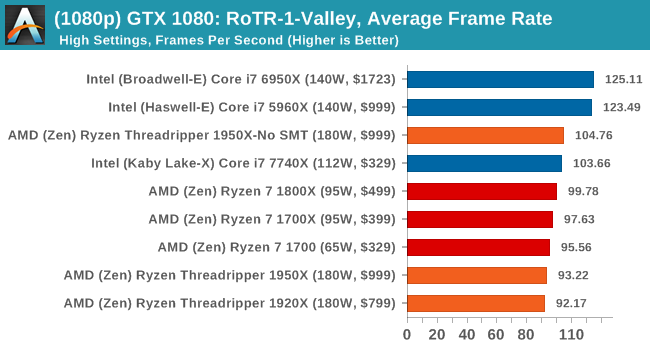
1080p
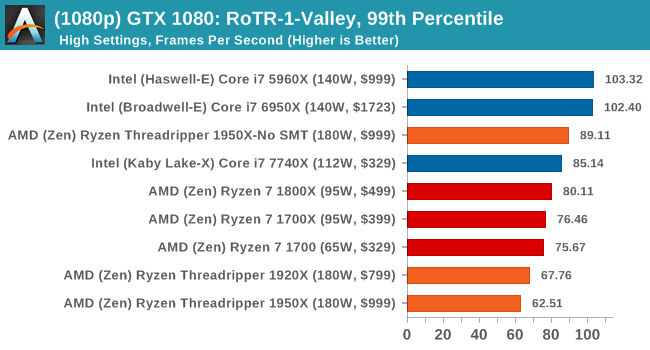
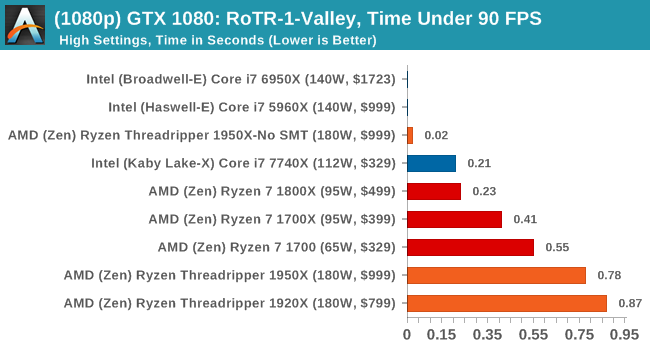
4K
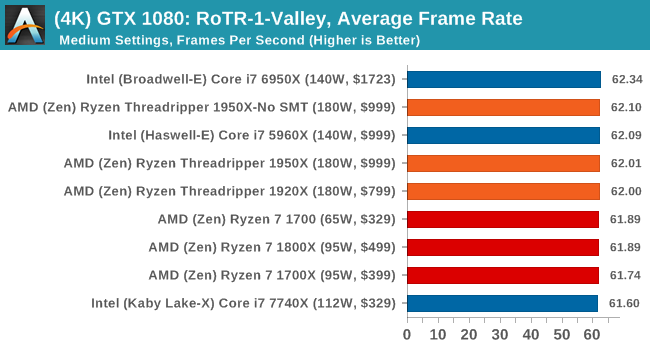
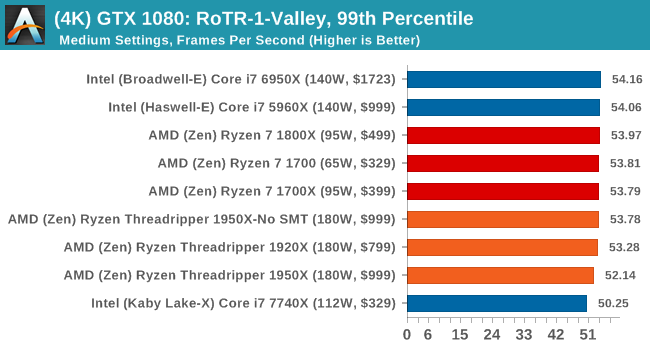
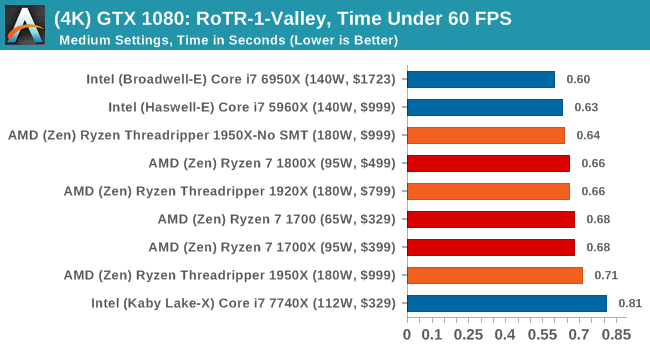
ASUS GTX 1060 Strix 6G Performance
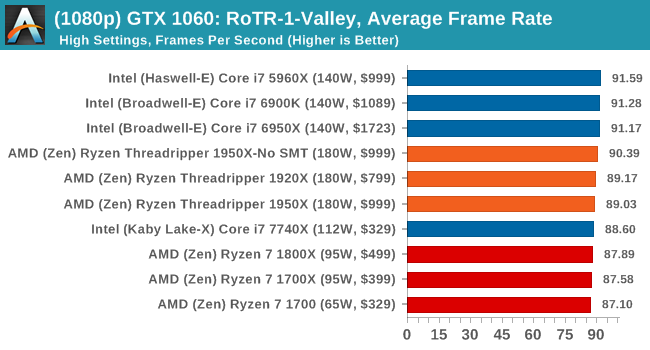
1080p
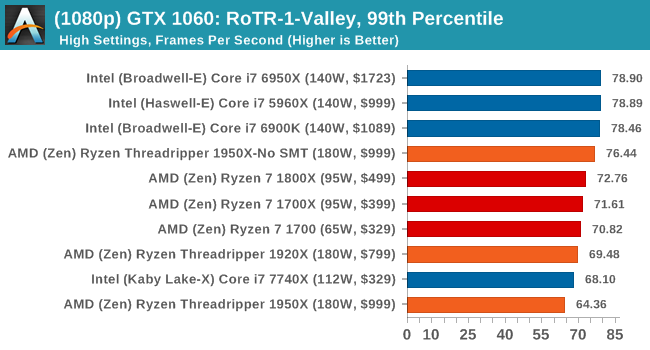
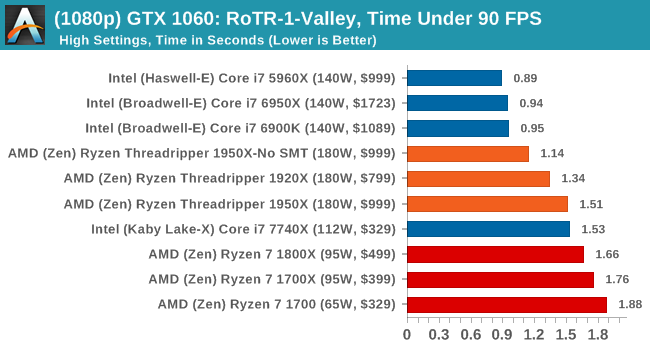
4K
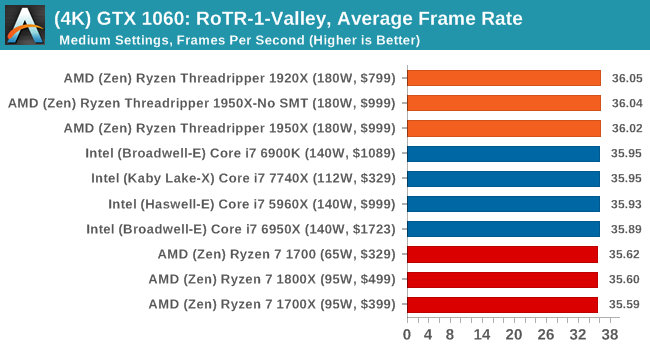
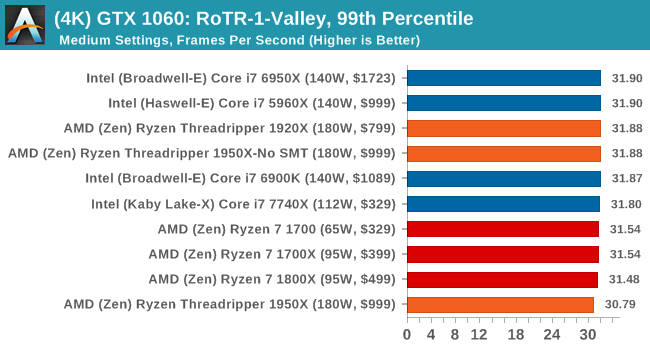
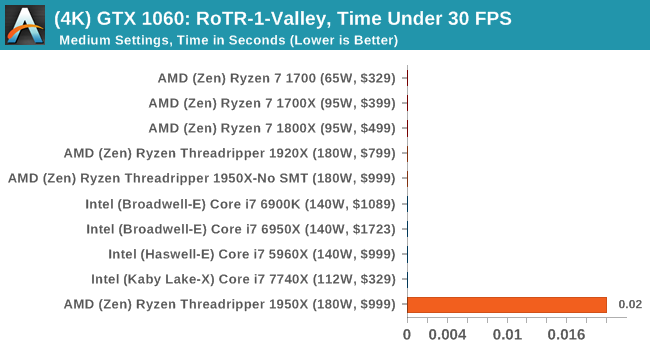
Sapphire Nitro R9 Fury 4G Performance
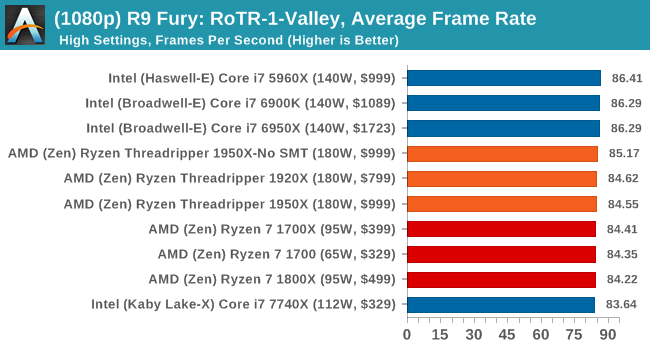
1080p

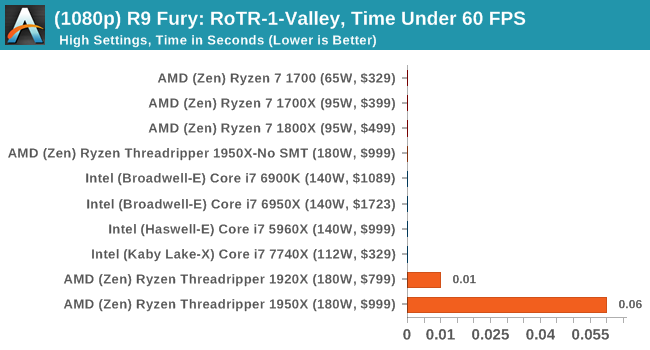
4K
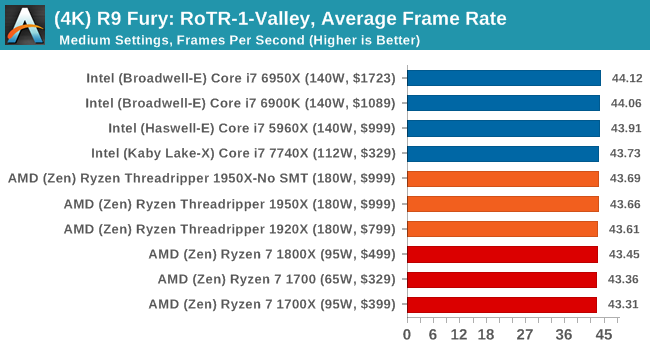
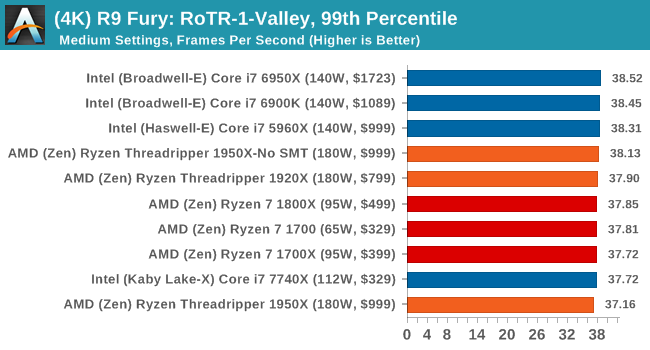
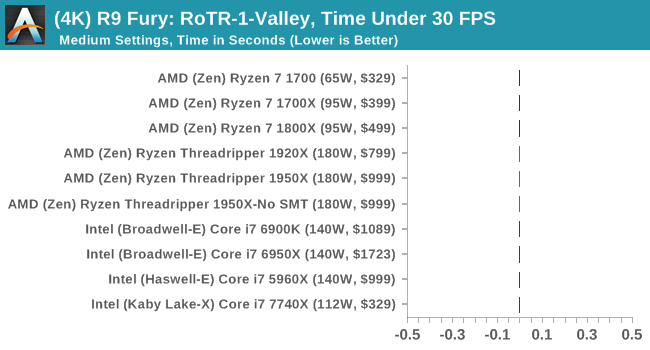
Sapphire Nitro RX 480 8G Performance
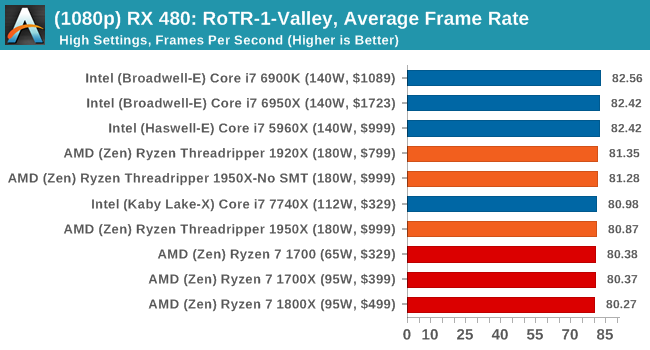
1080p
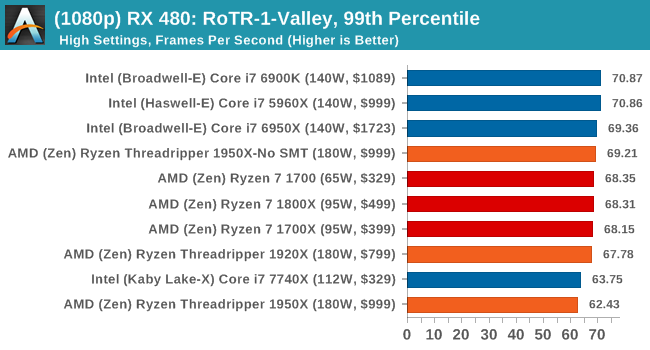
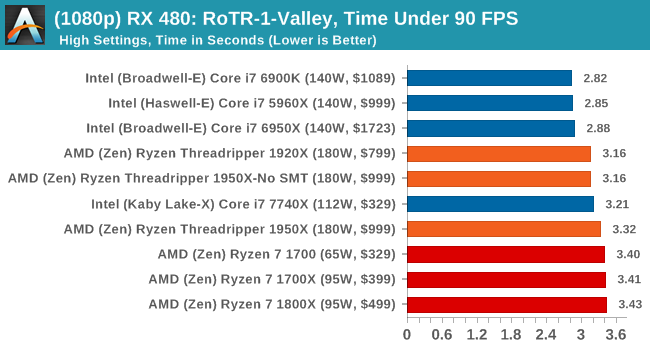
4K
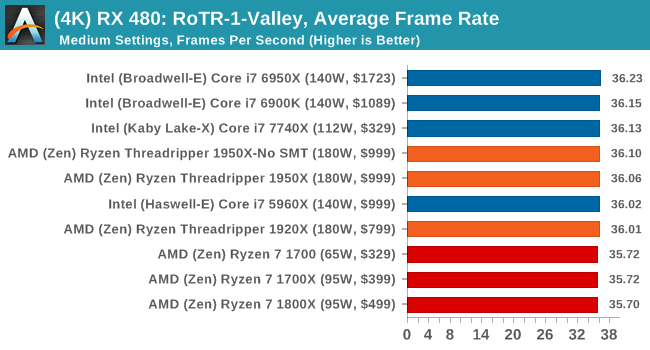
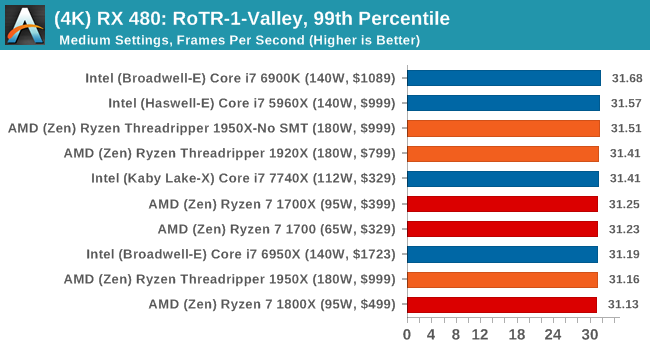

#2 Prophet’s Tomb

MSI GTX 1080 Gaming 8G Performance
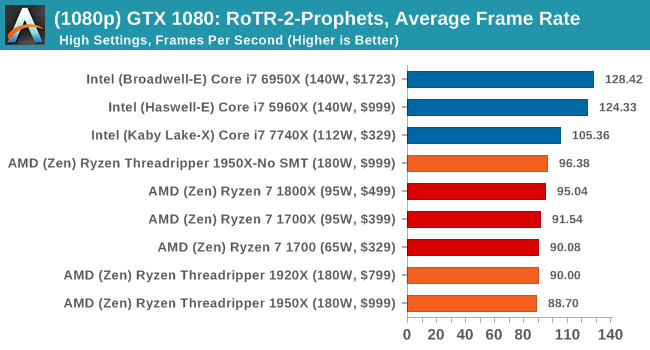
1080p
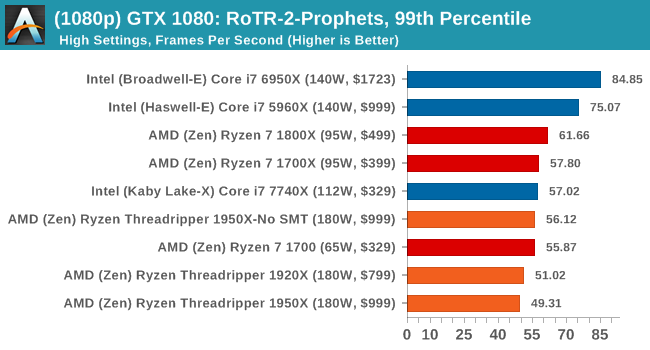
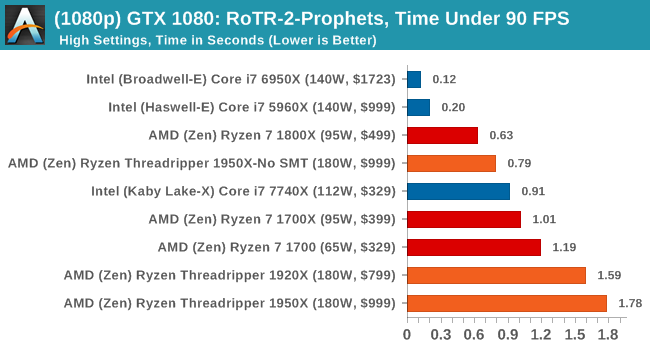
4K
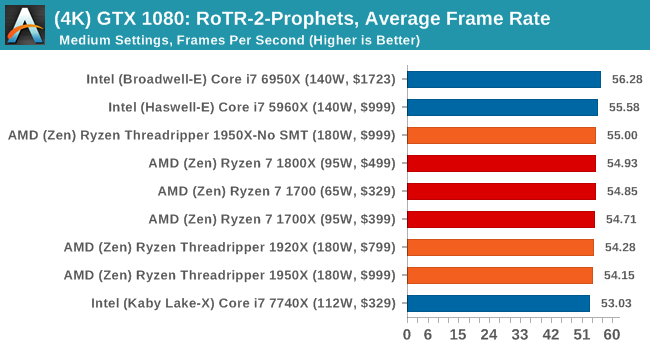
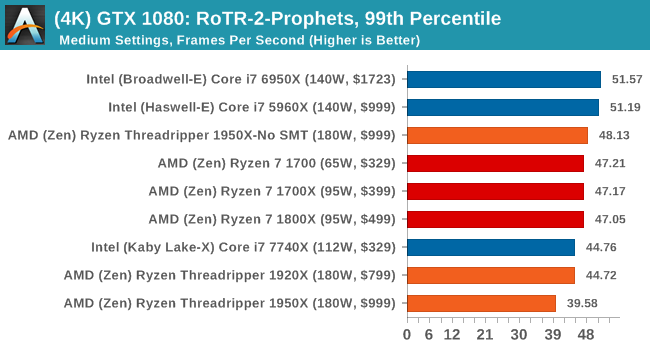
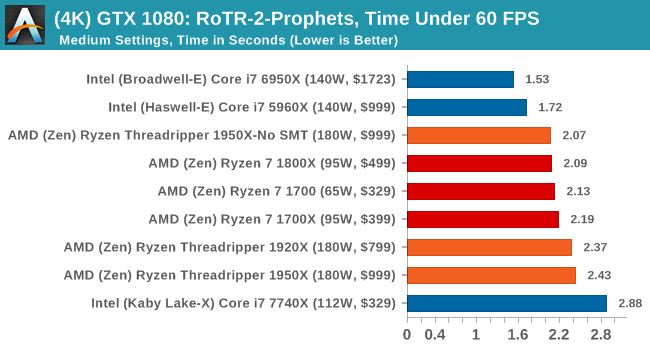
ASUS GTX 1060 Strix 6G Performance
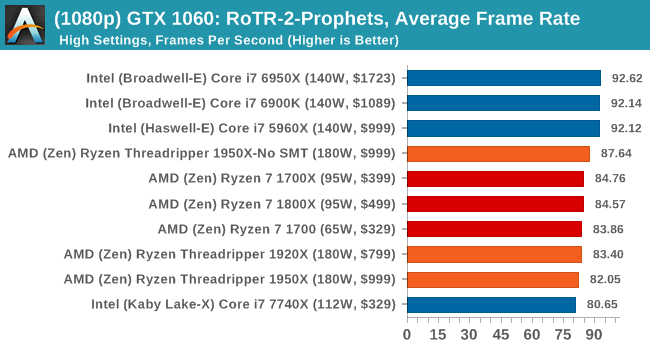
1080p
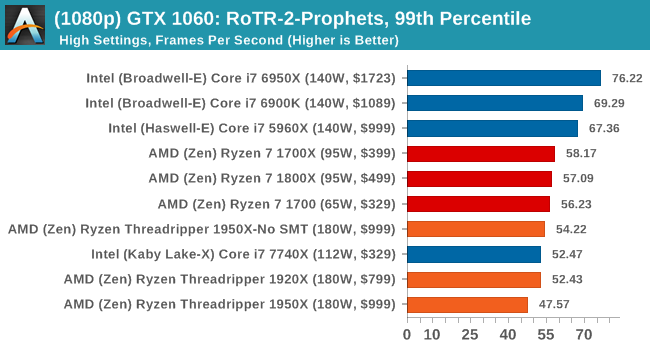
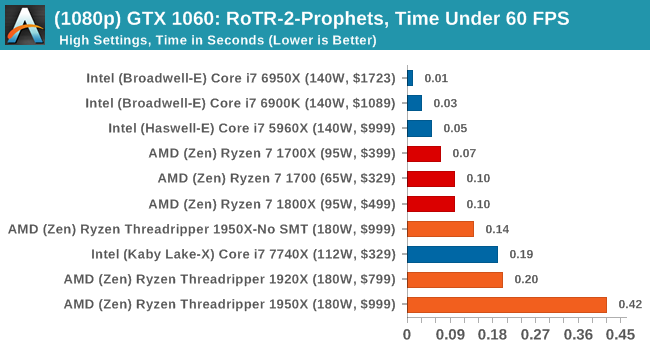
4K
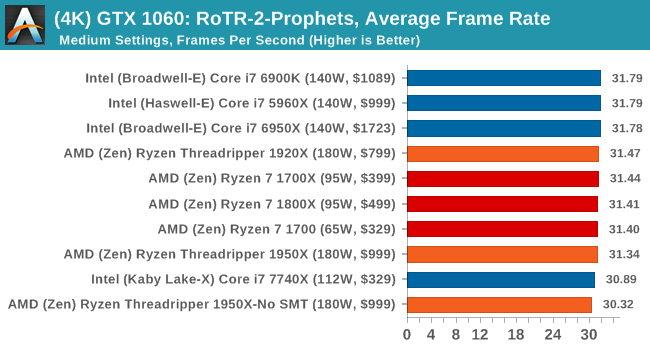
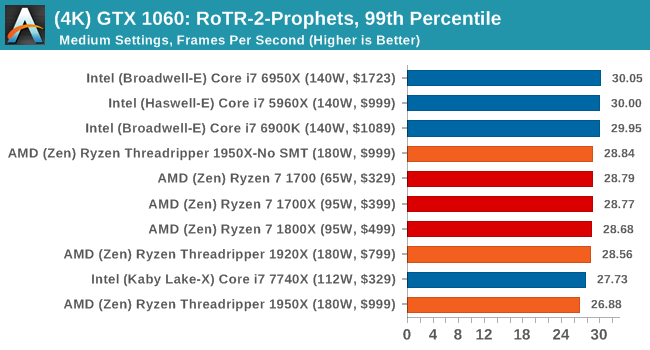
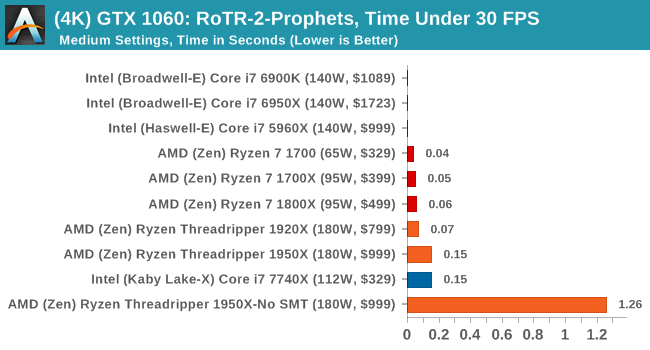
Sapphire Nitro R9 Fury 4G Performance
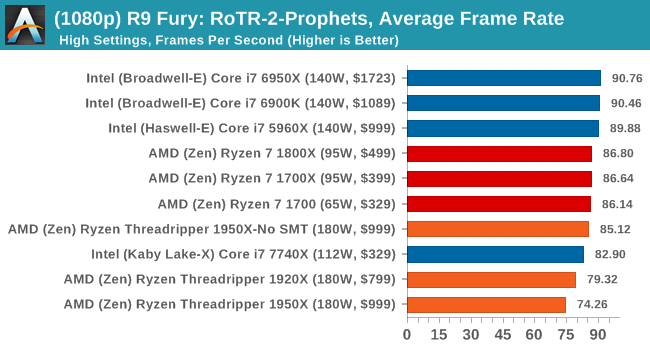
1080p
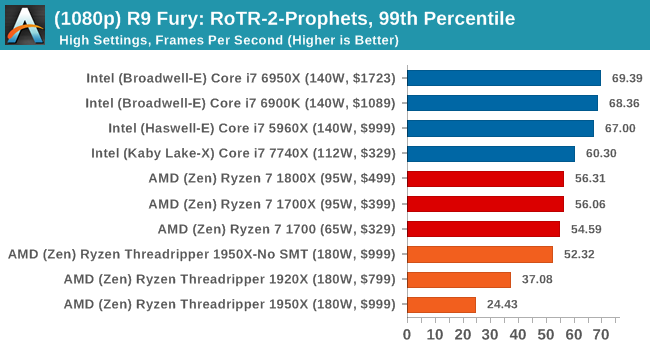
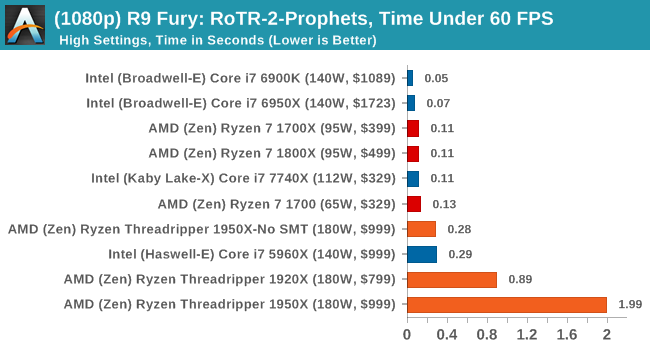
4K
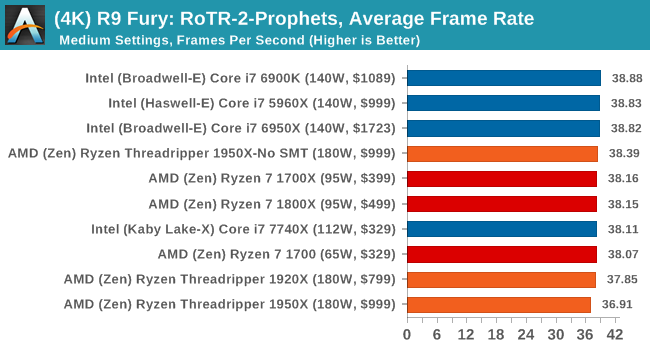
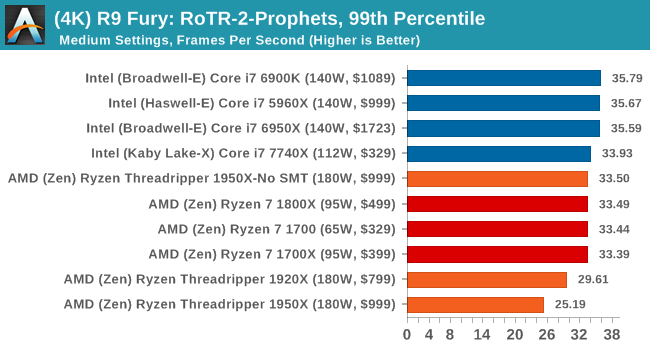
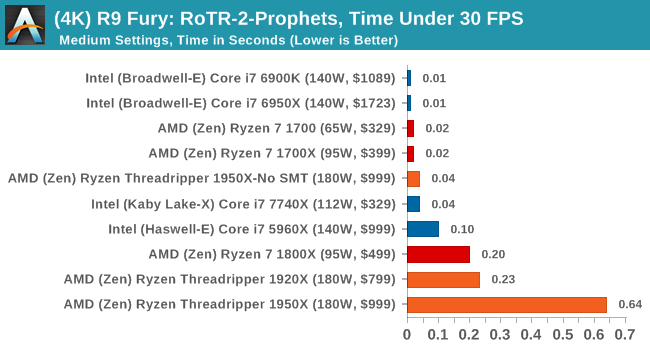
Sapphire Nitro RX 480 8G Performance
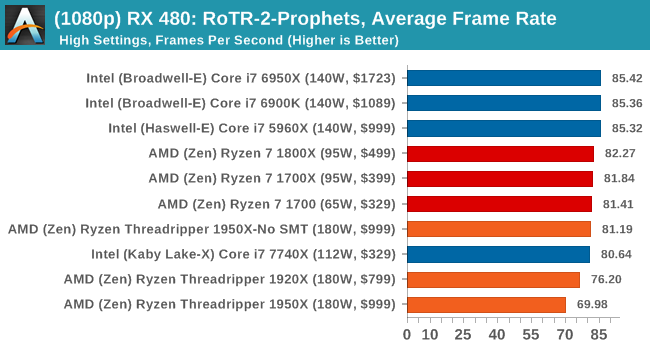
1080p
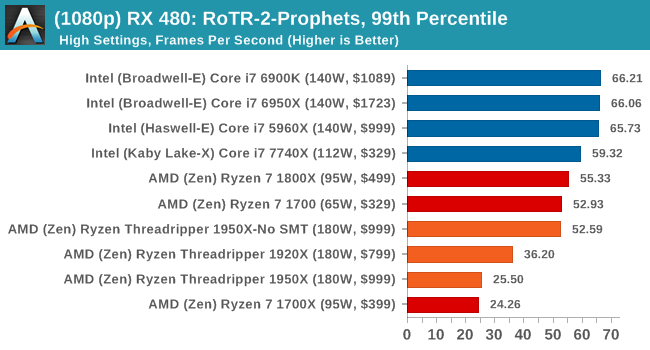
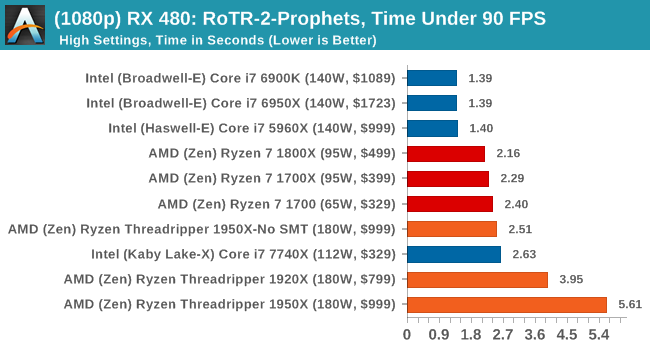
4K
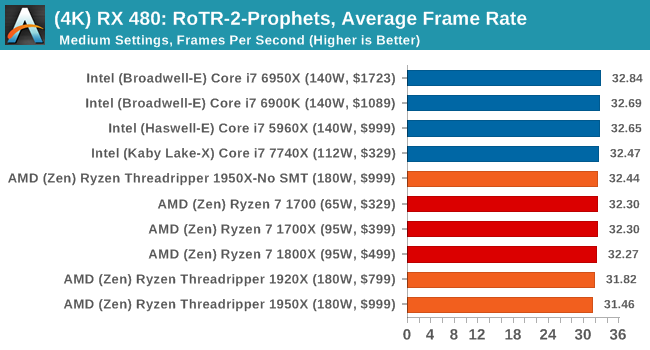
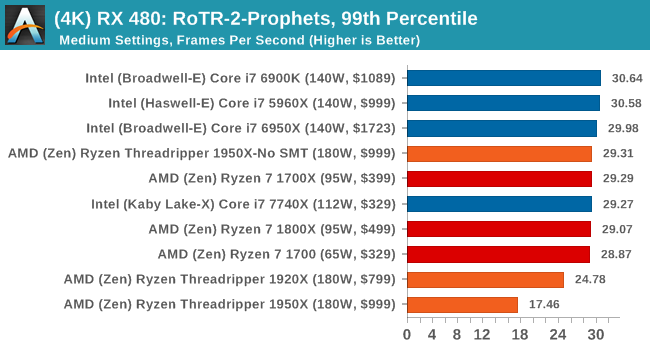
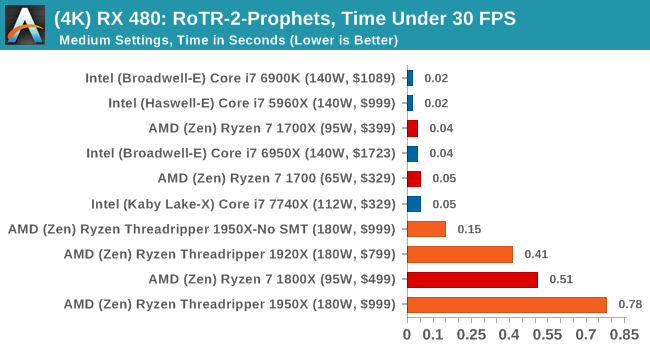
#3 Spine of the Mountain Geothermal Valley
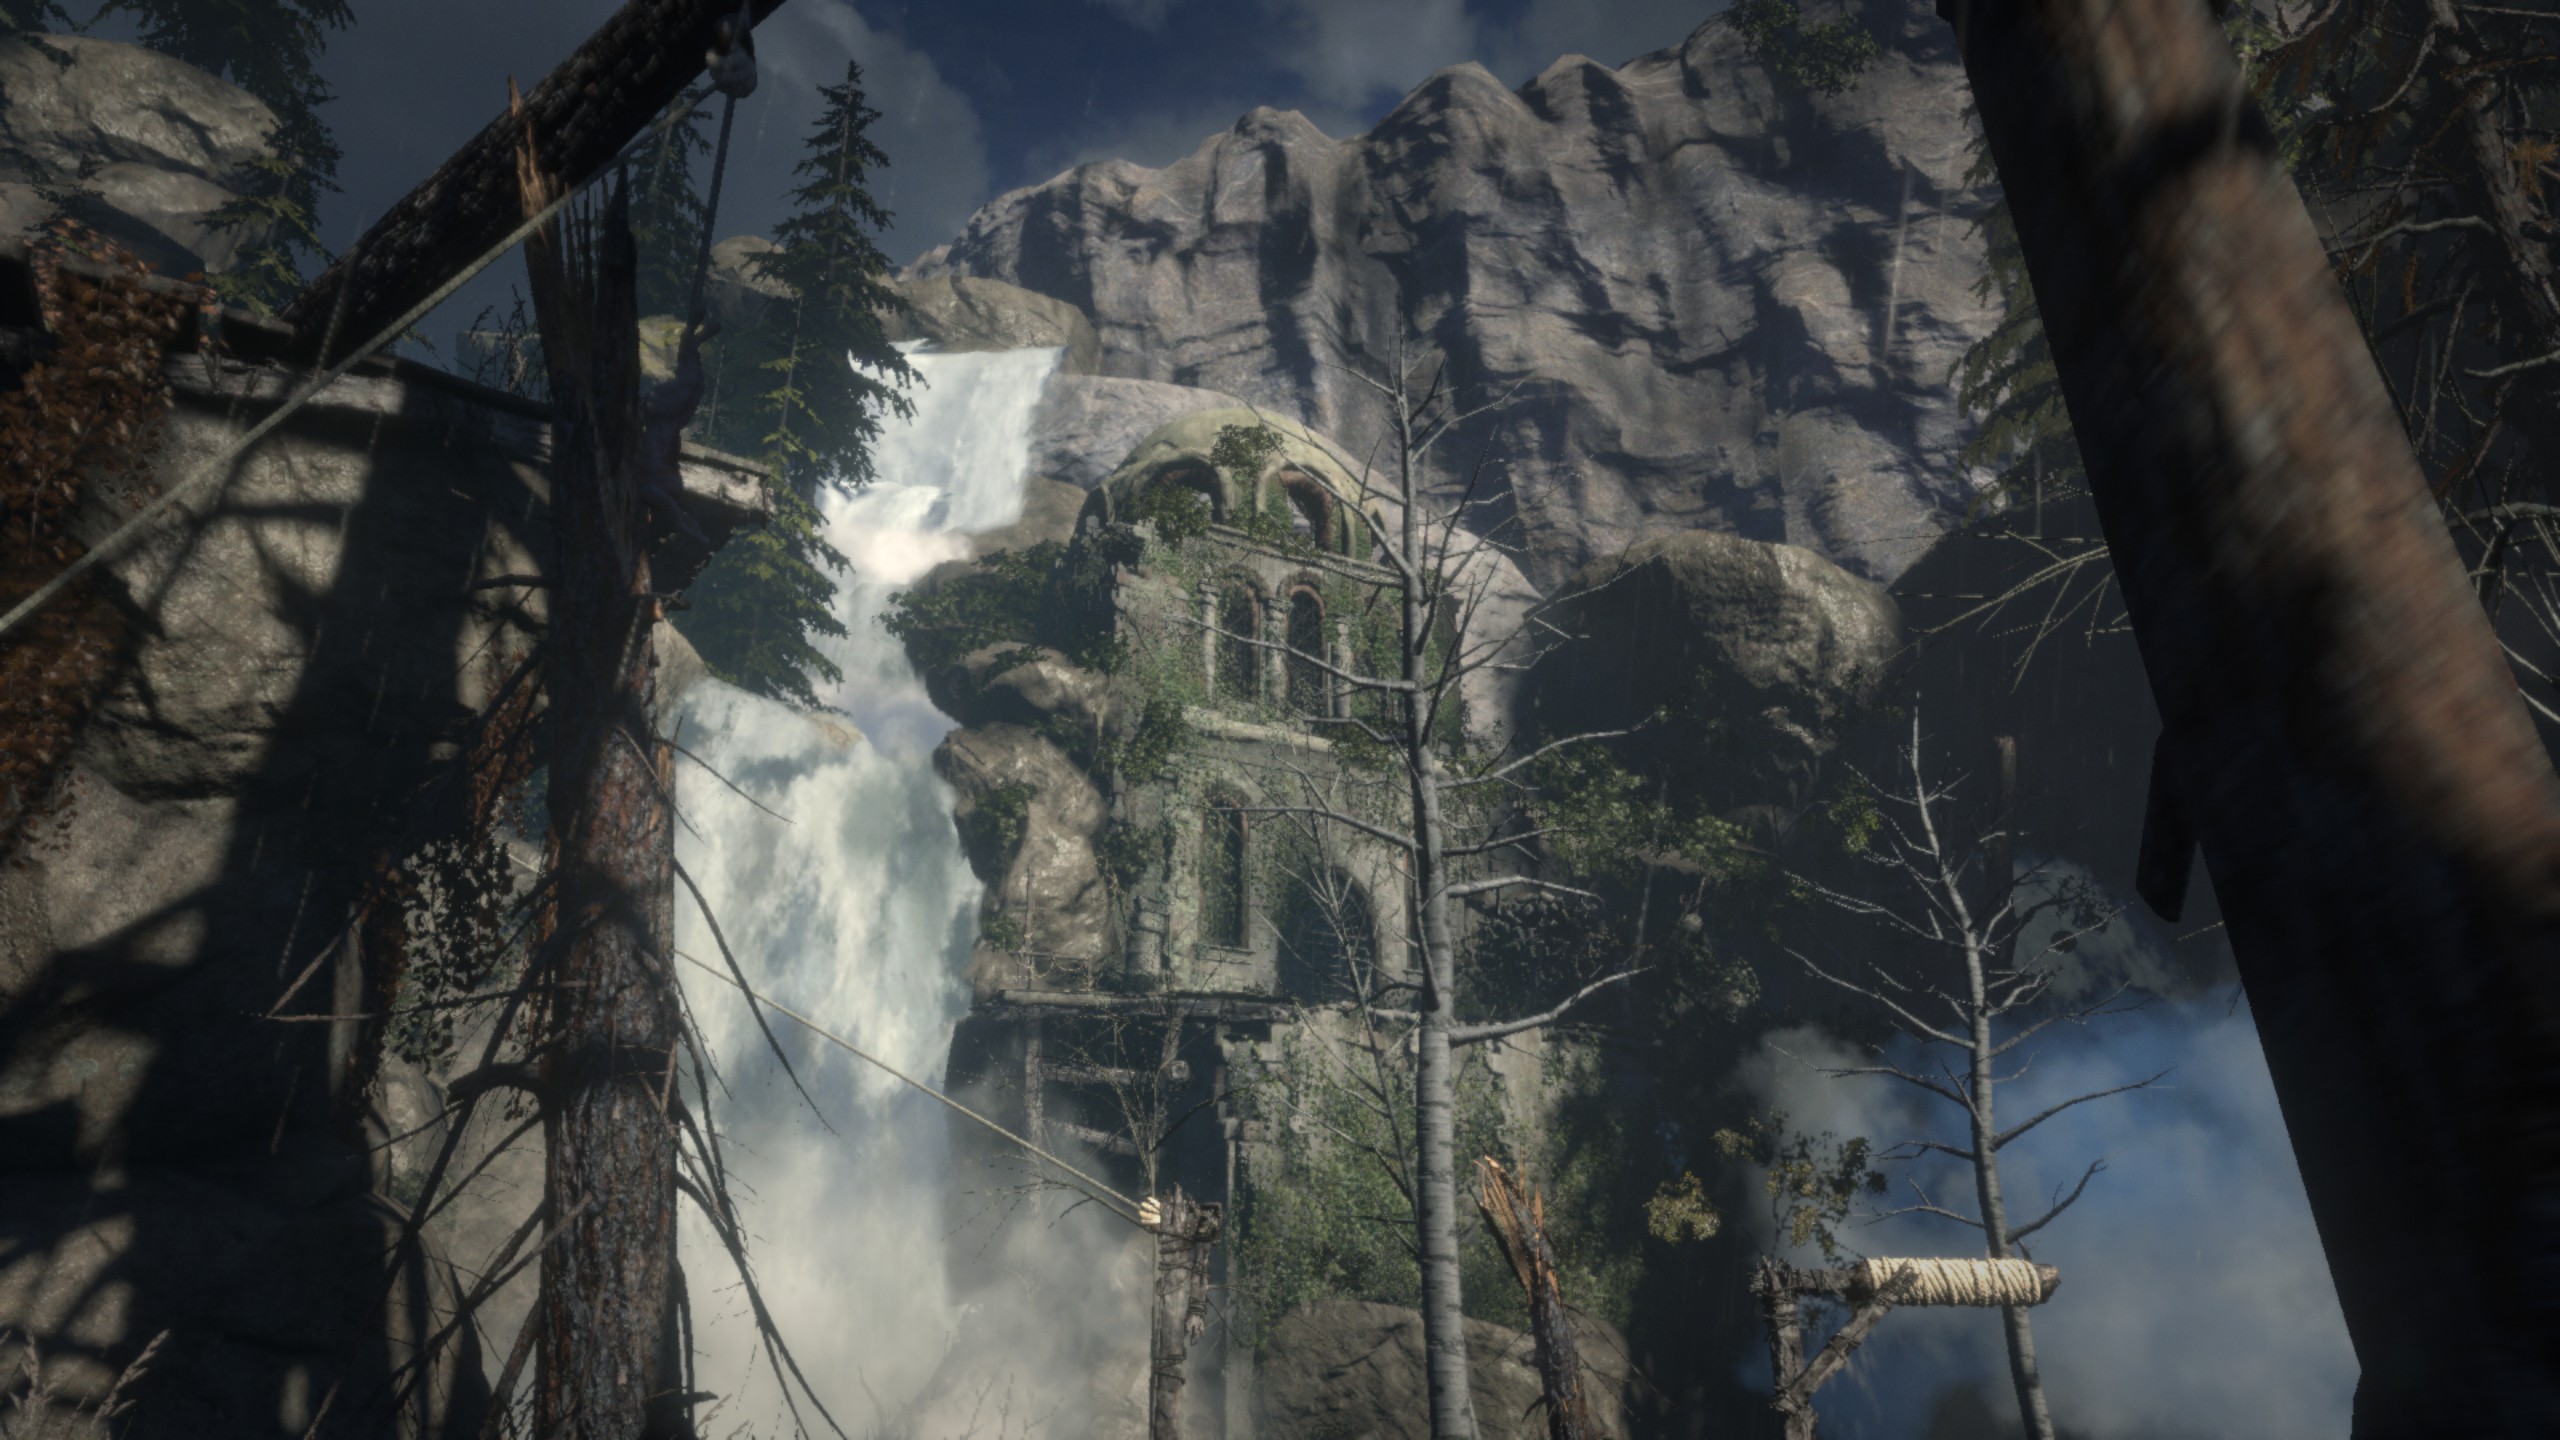
MSI GTX 1080 Gaming 8G Performance
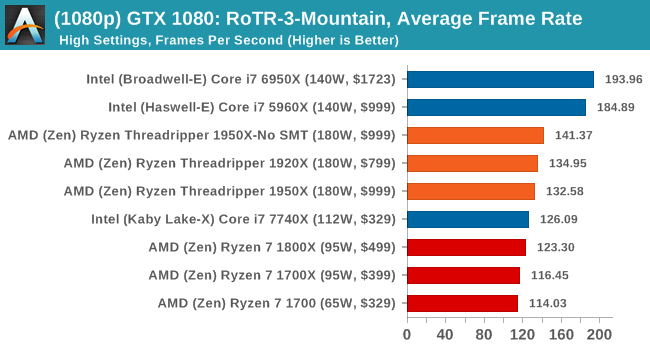
1080p
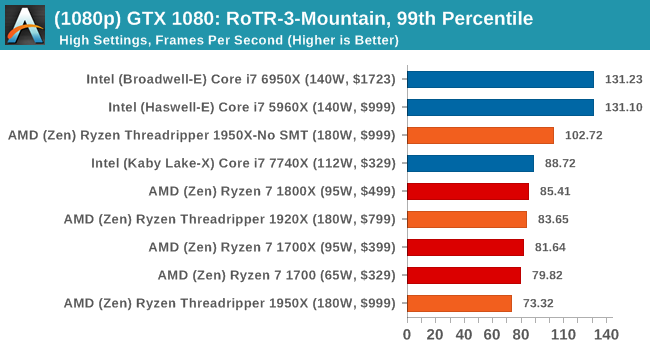
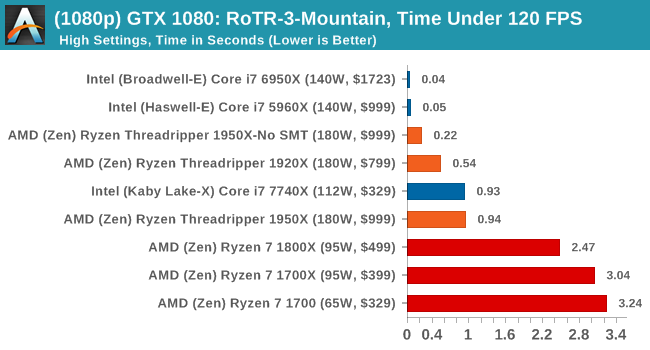
4K

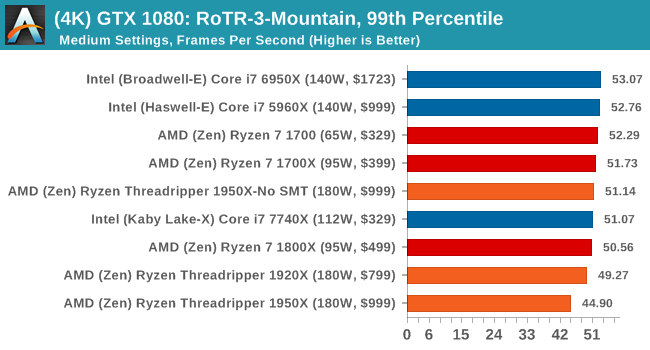
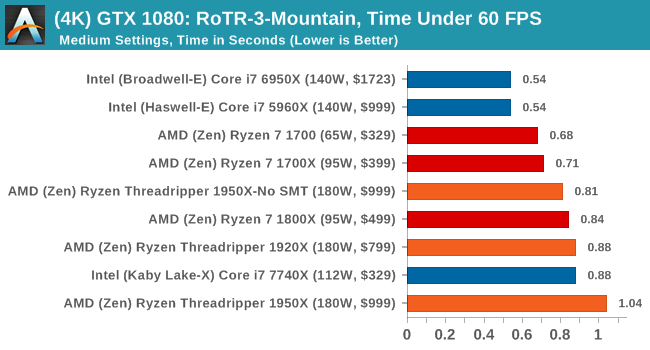
ASUS GTX 1060 Strix 6G Performance
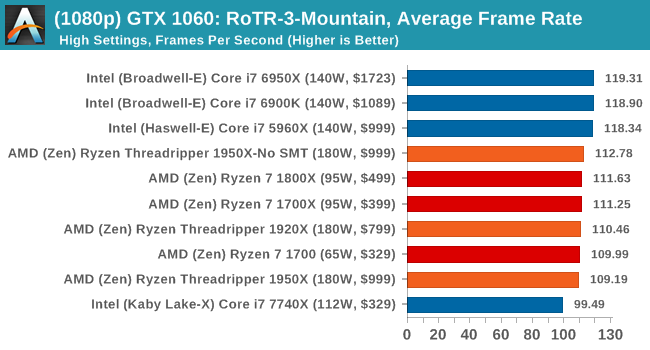
1080p
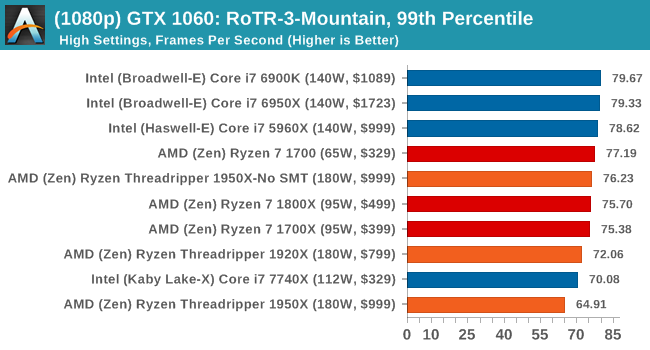
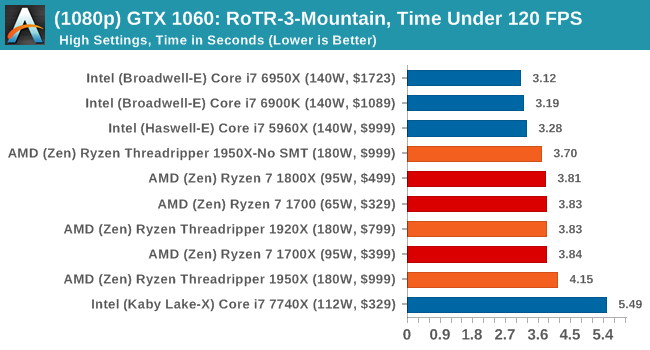
4K
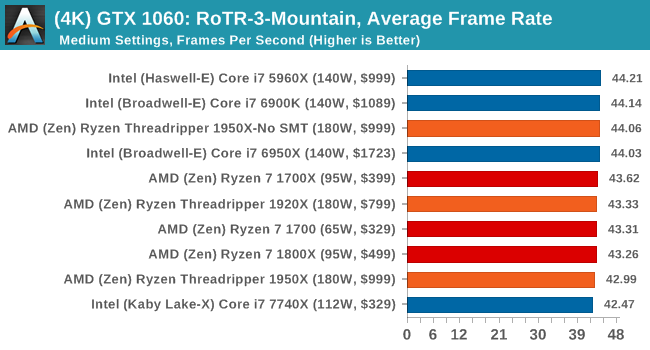
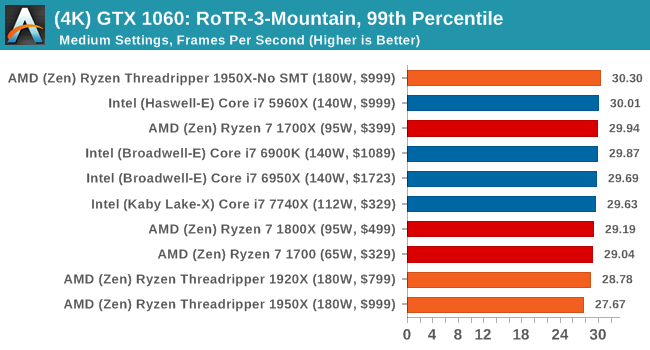
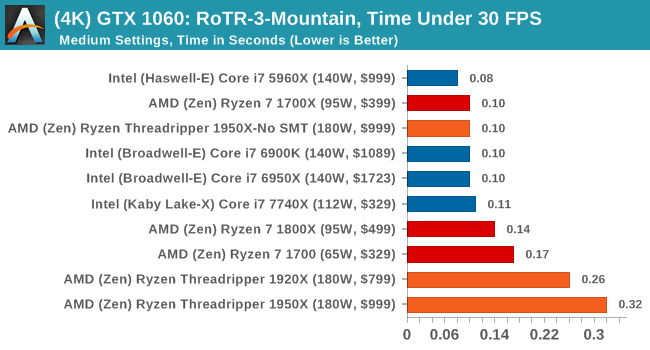
Sapphire Nitro R9 Fury 4G Performance
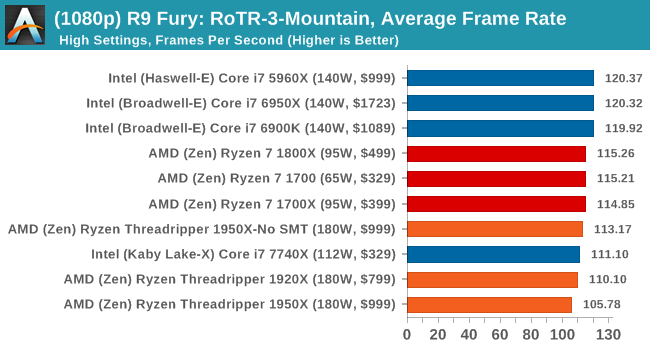
1080p
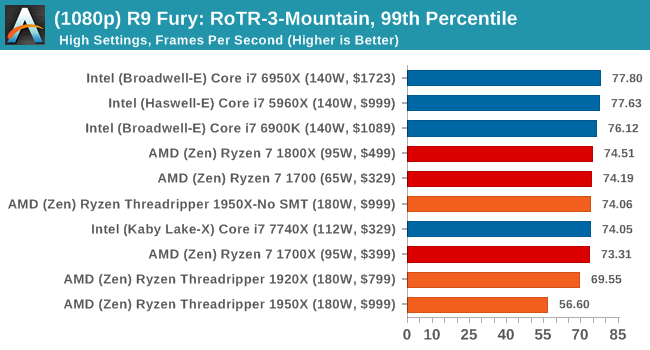
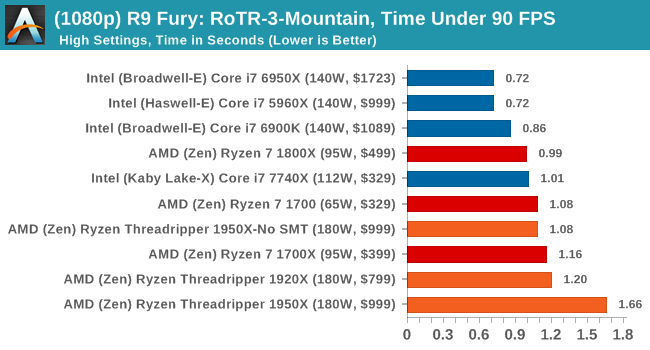
4K
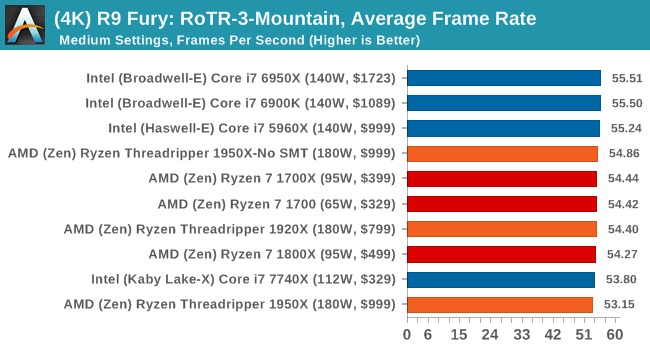
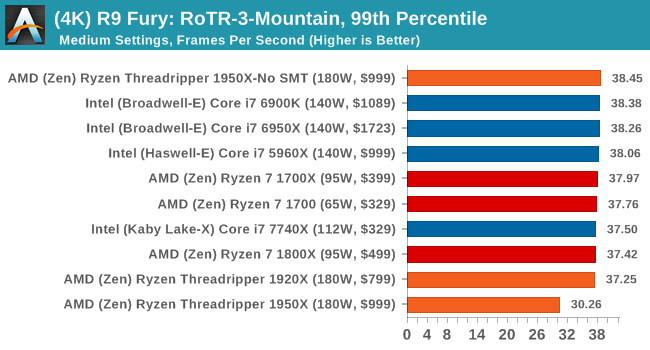
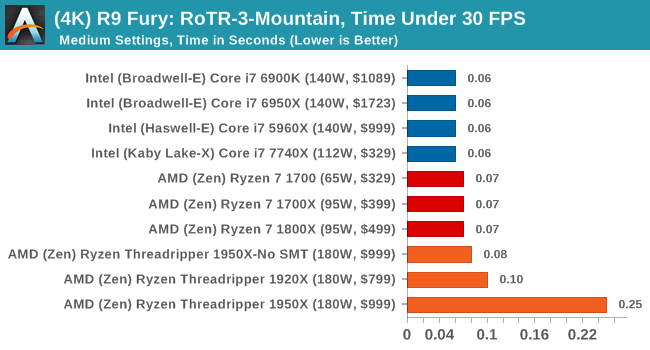
Sapphire Nitro RX 480 8G Performance
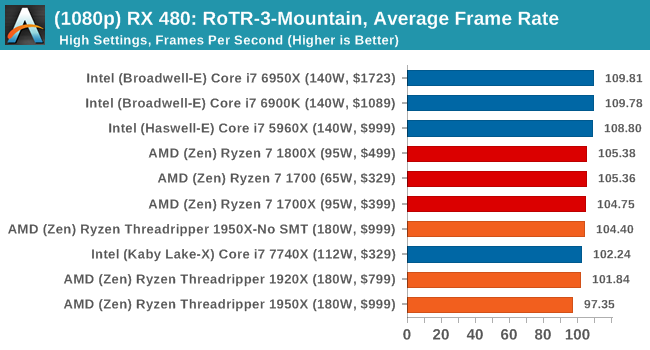
1080p
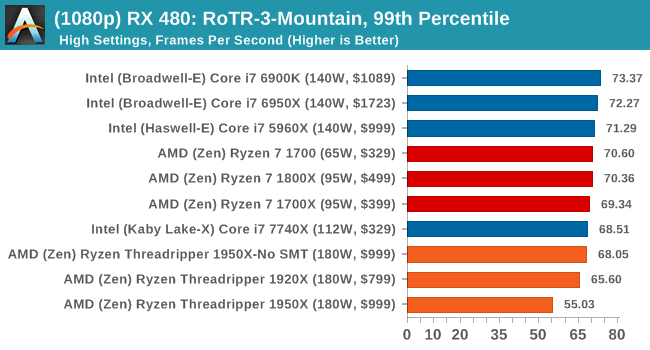
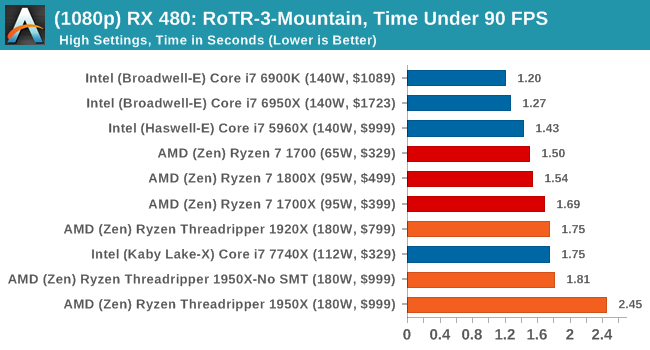
The 4K
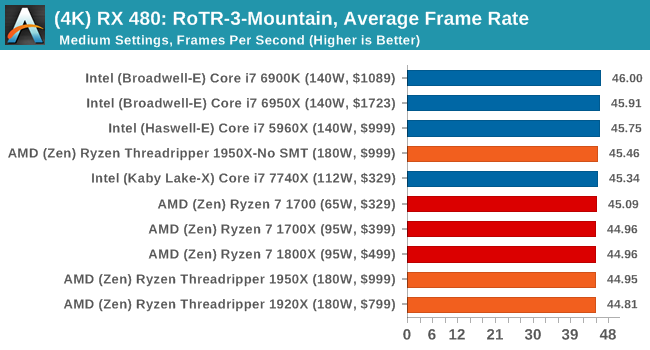
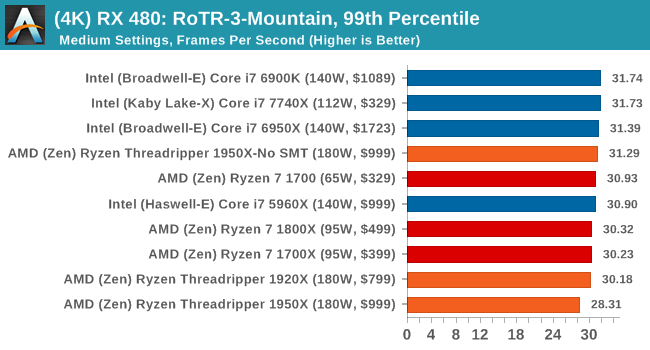
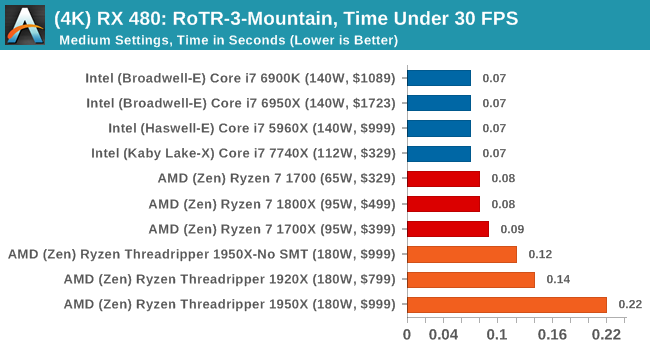
It's clear from these results that the 1950X is not the best gaming chip when in its default mode.
Rocket League
Hilariously simple pick-up-and-play games are great fun. I'm a massive fan of the Katamari franchise for that reason — passing start on a controller and rolling around, picking up things to get bigger, is extremely simple. Until we get a PC version of Katamari that I can benchmark, we'll focus on Rocket League.
Rocket League combines the elements of pick-up-and-play, allowing users to jump into a game with other people (or bots) to play football with cars with zero rules. The title is built on Unreal Engine 3, which is somewhat old at this point, but it allows users to run the game on super-low-end systems while still taxing the big ones. Since the release in 2015, it has sold over 5 million copies and seems to be a fixture at LANs and game shows. Users who train get very serious, playing in teams and leagues with very few settings to configure, and everyone is on the same level. Rocket League is quickly becoming one of the favored titles for e-sports tournaments, especially when e-sports contests can be viewed directly from the game interface.

Based on these factors, plus the fact that it is an extremely fun title to load and play, we set out to find the best way to benchmark it. Unfortunately for the most part automatic benchmark modes for games are few and far between. Partly because of this, but also on the basis that it is built on the Unreal 3 engine, Rocket League does not have a benchmark mode. In this case, we have to develop a consistent run and record the frame rate.
Read our initial analysis on our Rocket League benchmark on low-end graphics here.
With Rocket League, there is no benchmark mode, so we have to perform a series of automated actions, similar to a racing game having a fixed number of laps. We take the following approach: Using Fraps to record the time taken to show each frame (and the overall frame rates), we use an automation tool to set up a consistent 4v4 bot match on easy, with the system applying a series of inputs throughout the run, such as switching camera angles and driving around.
It turns out that this method is nicely indicative of a real bot match, driving up walls, boosting and even putting in the odd assist, save and/or goal, as weird as that sounds for an automated set of commands. To maintain consistency, the commands we apply are not random but time-fixed, and we also keep the map the same (Aquadome, known to be a tough map for GPUs due to water/transparency) and the car customization constant. We start recording just after a match starts, and record for 4 minutes of game time (think 5 laps of a DIRT: Rally benchmark), with average frame rates, 99th percentile and frame times all provided.
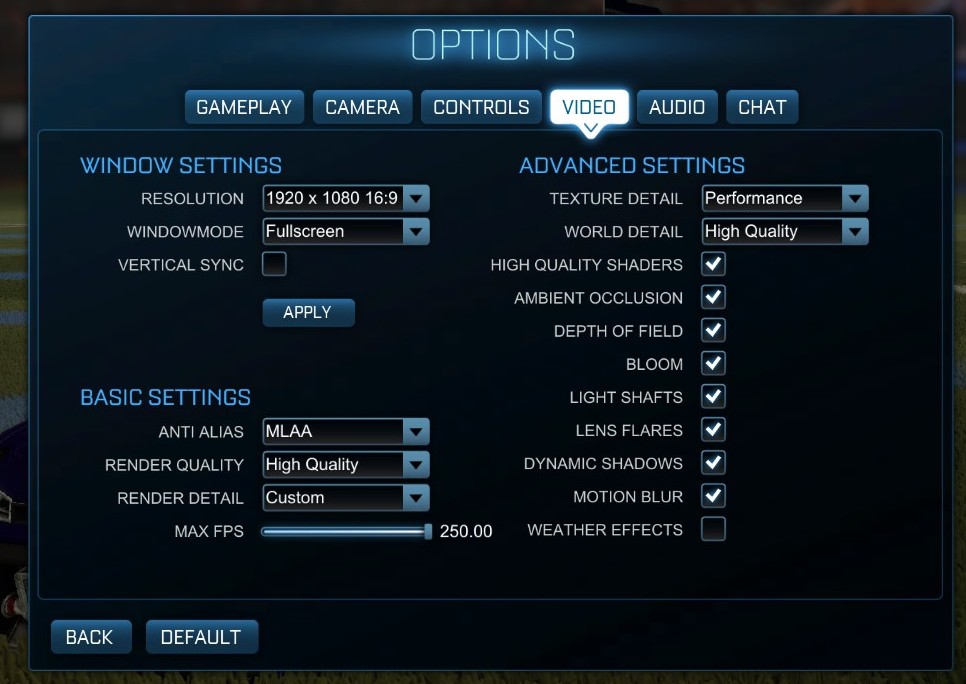
The graphics settings for Rocket League come in four broad, generic settings: Low, Medium, High and High FXAA. There are advanced settings in place for shadows and details; however, for these tests, we keep to the generic settings. For both 1920x1080 and 4K resolutions, we test at the High preset with an unlimited frame cap.
All of our benchmark results can also be found in our benchmark engine, Bench.
MSI GTX 1080 Gaming 8G Performance
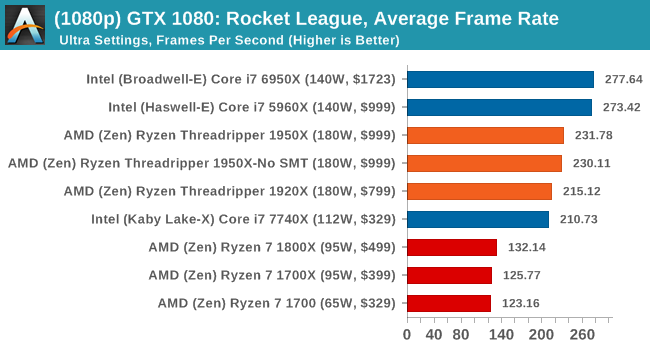
1080p
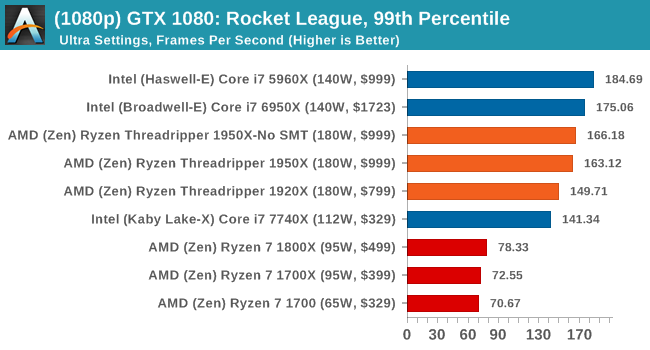
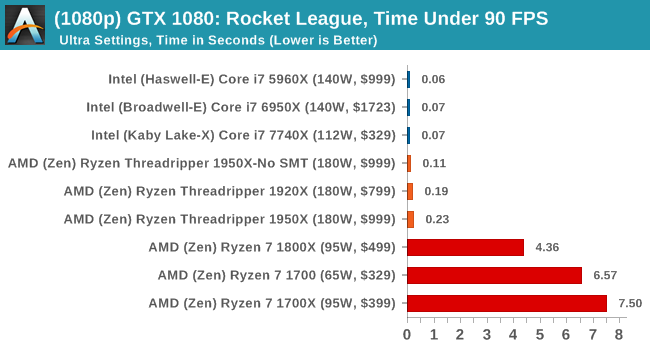
4K
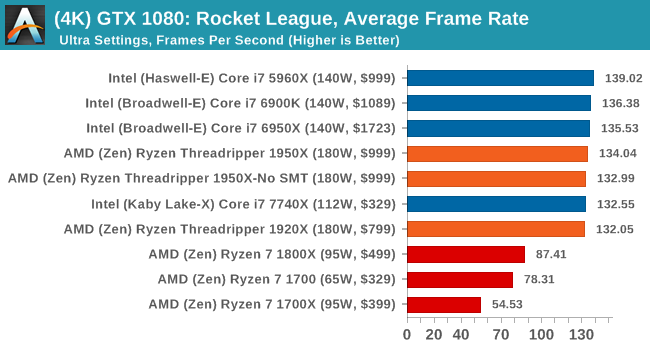

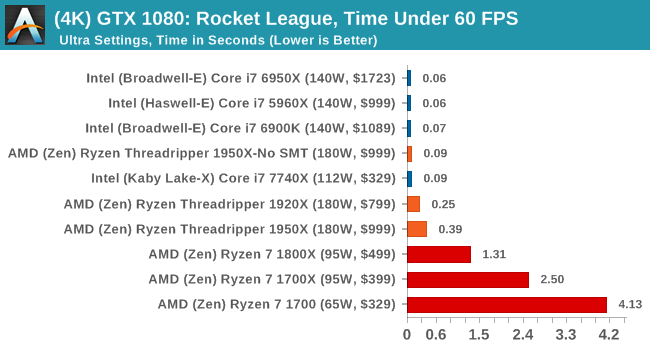
ASUS GTX 1060 Strix 6G Performance
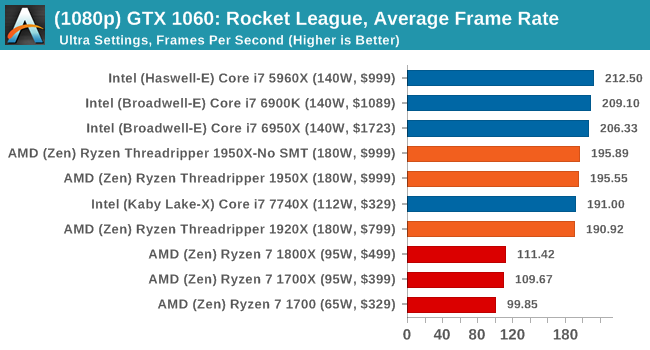
1080p
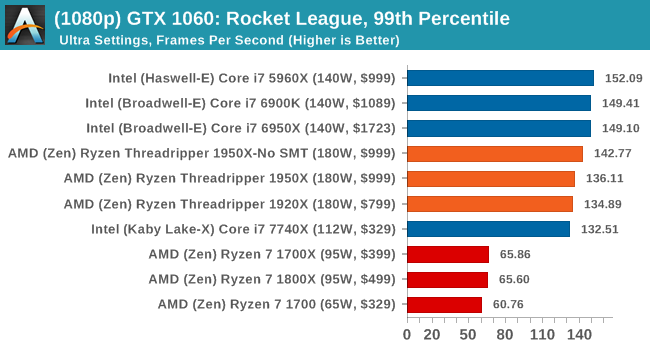
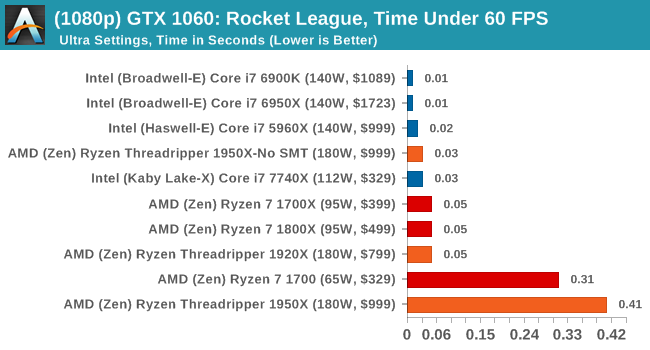
4K
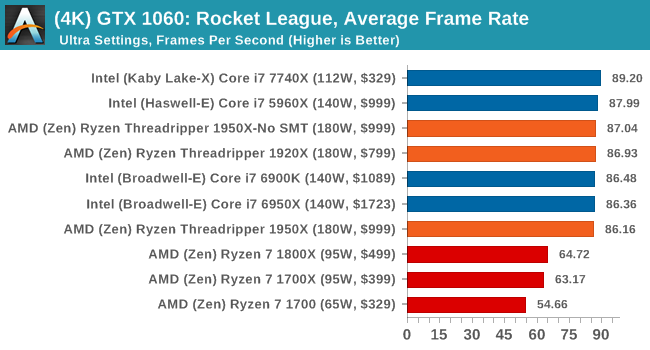
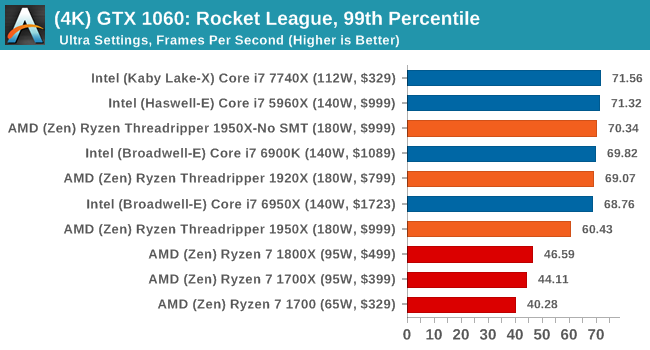
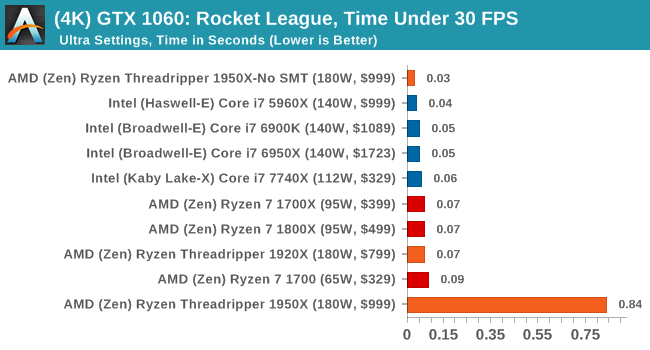
Sapphire Nitro R9 Fury 4G Performance
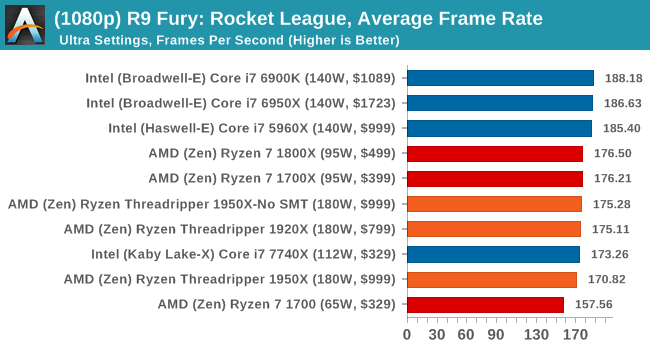
1080p
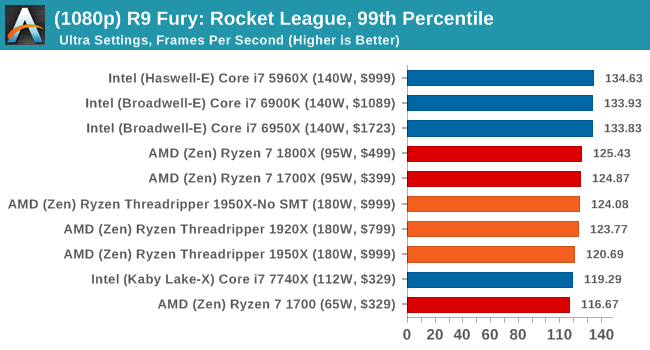
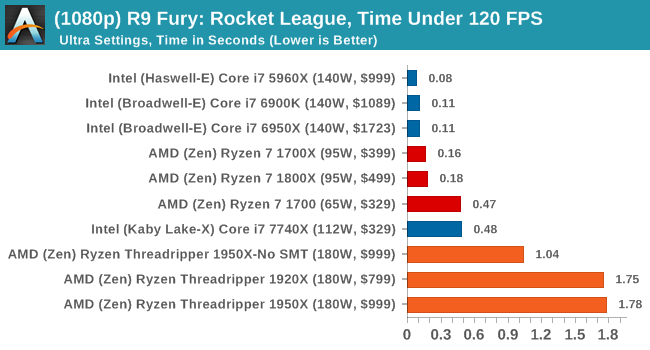
4K
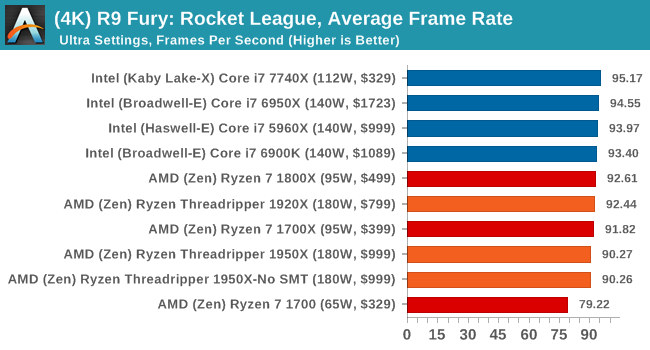
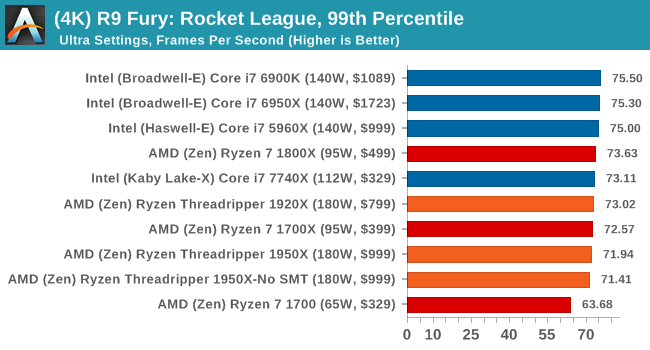
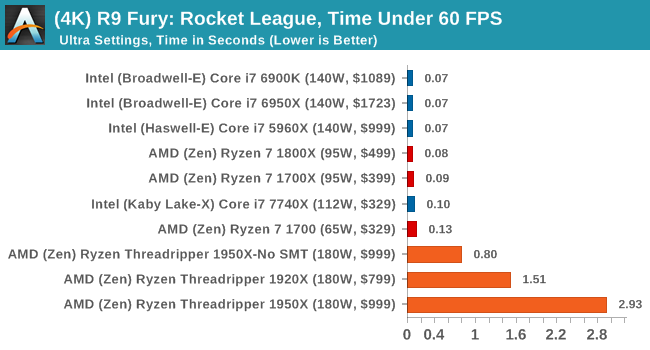
Sapphire Nitro RX 480 8G Performance
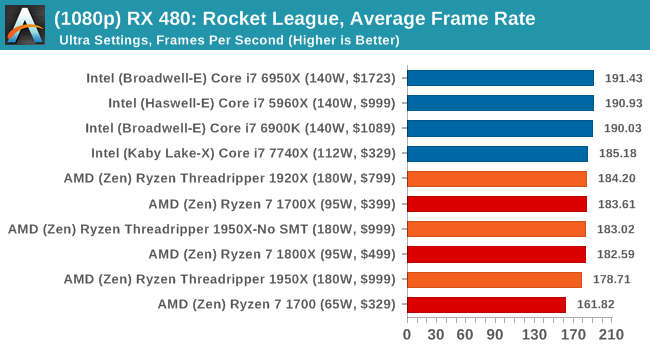
1080p
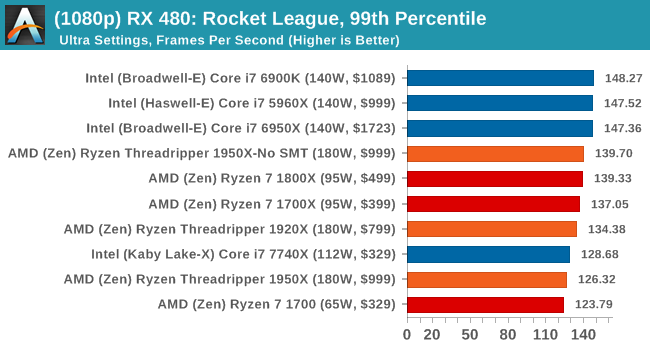
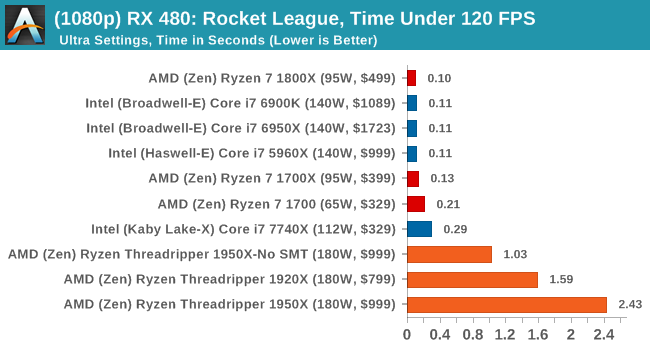
4K
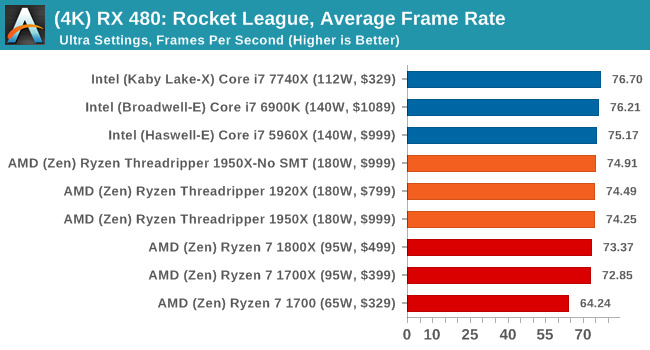
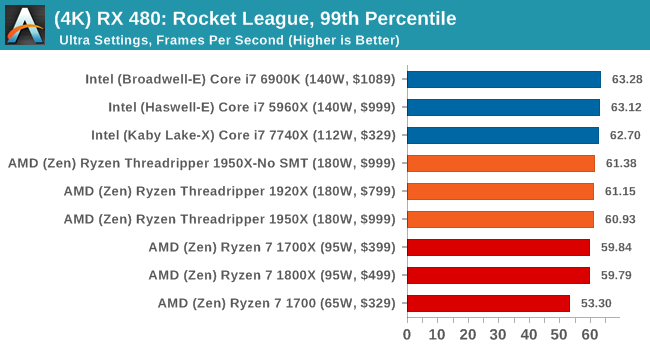
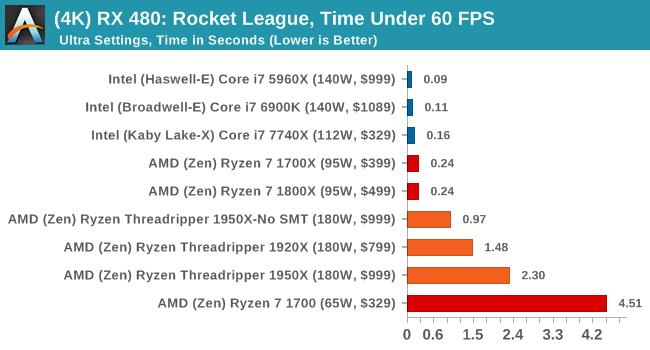
With Ryzen, we encounted some odd performance issues when using NVIDIA-based video cards that caused those cards to significantly underperform. However equally strangely, the issues we have with Ryzen on Rocket League with NVIDIA GPUs seem to almost vanish when using Threadripper. Again, still no easy wins here as Intel seems to take Rocket League in its stride, but SMT-off mode still helps the 1950X. The Time Under graphs give some cause for concern, with the 1950X consistently being at the bottom of that graph.
Grand Theft Auto
The highly anticipated iteration of the Grand Theft Auto franchise hit the shelves on April 14th 2015, with both AMD and NVIDIA in tow to help optimize the title. GTA doesn’t provide graphical presets, but opens up the options to users and extends the boundaries by pushing even the hardest systems to the limit using Rockstar’s Advanced Game Engine under DirectX 11. Whether the user is flying high in the mountains with long draw distances or dealing with assorted trash in the city, when cranked up to maximum it creates stunning visuals but hard work for both the CPU and the GPU.

For our test we have scripted a version of the in-game benchmark. The in-game benchmark consists of five scenarios: four short panning shots with varying lighting and weather effects, and a fifth action sequence that lasts around 90 seconds. We use only the final part of the benchmark, which combines a flight scene in a jet followed by an inner city drive-by through several intersections followed by ramming a tanker that explodes, causing other cars to explode as well. This is a mix of distance rendering followed by a detailed near-rendering action sequence, and the title thankfully spits out frame time data.
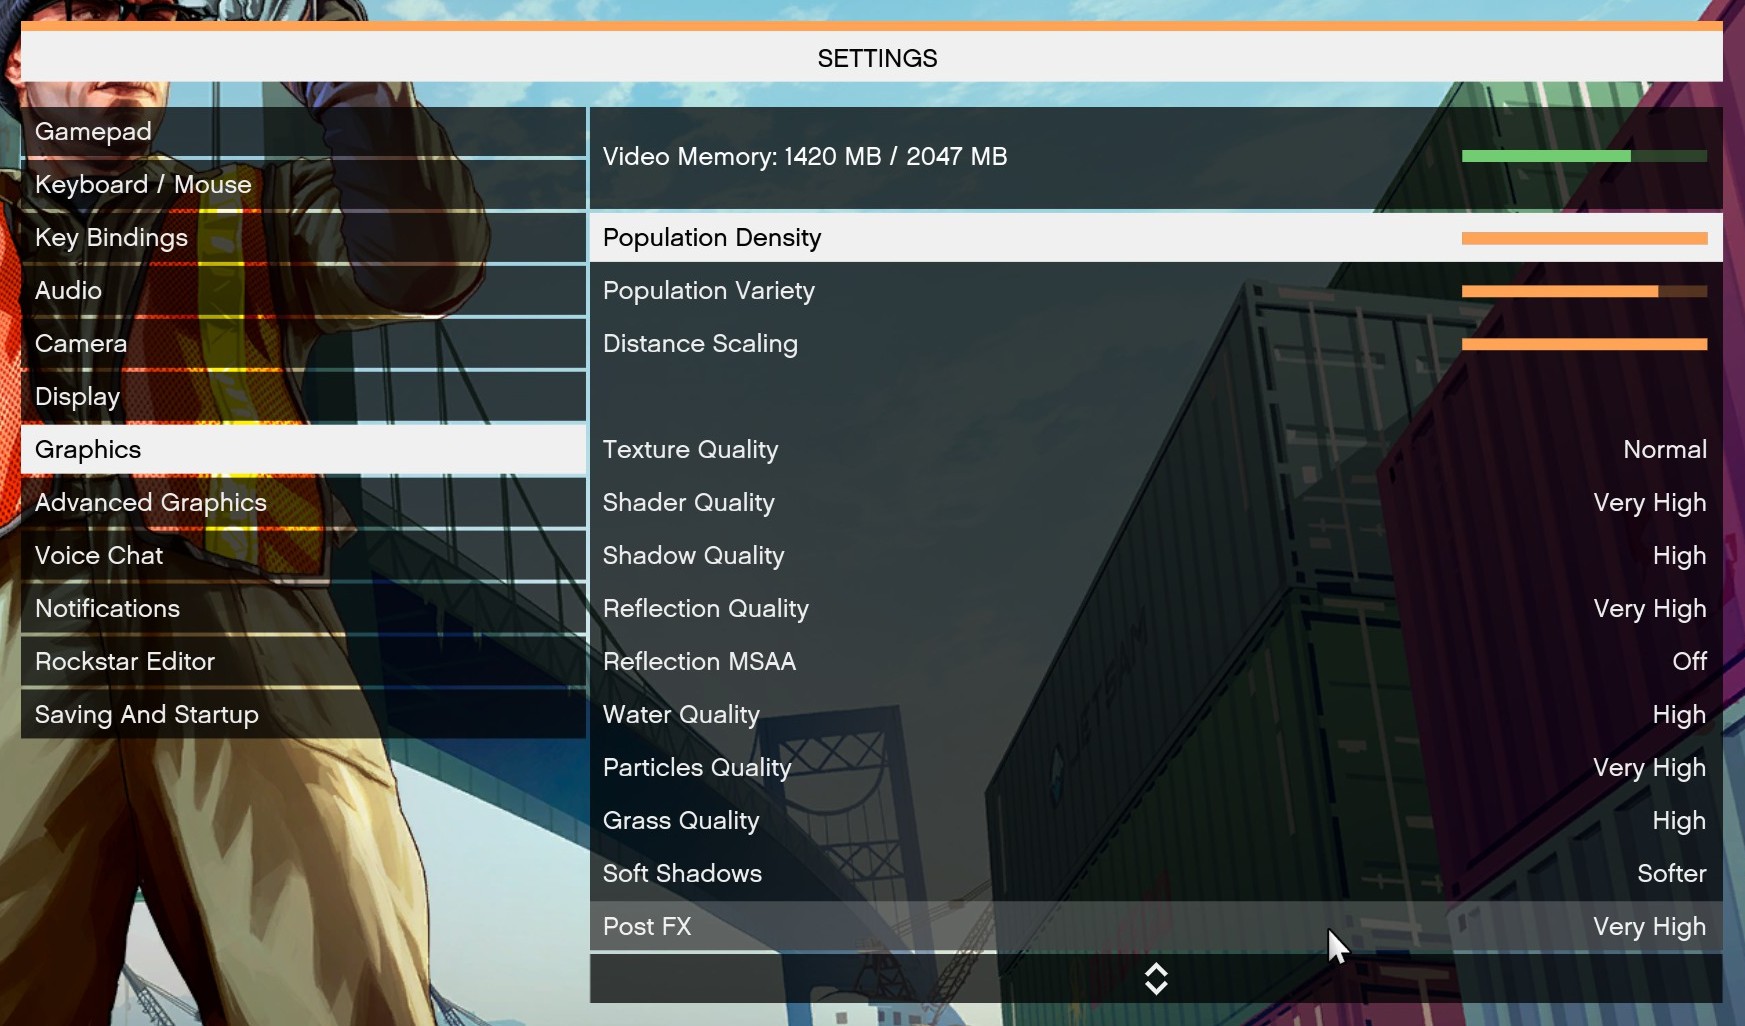
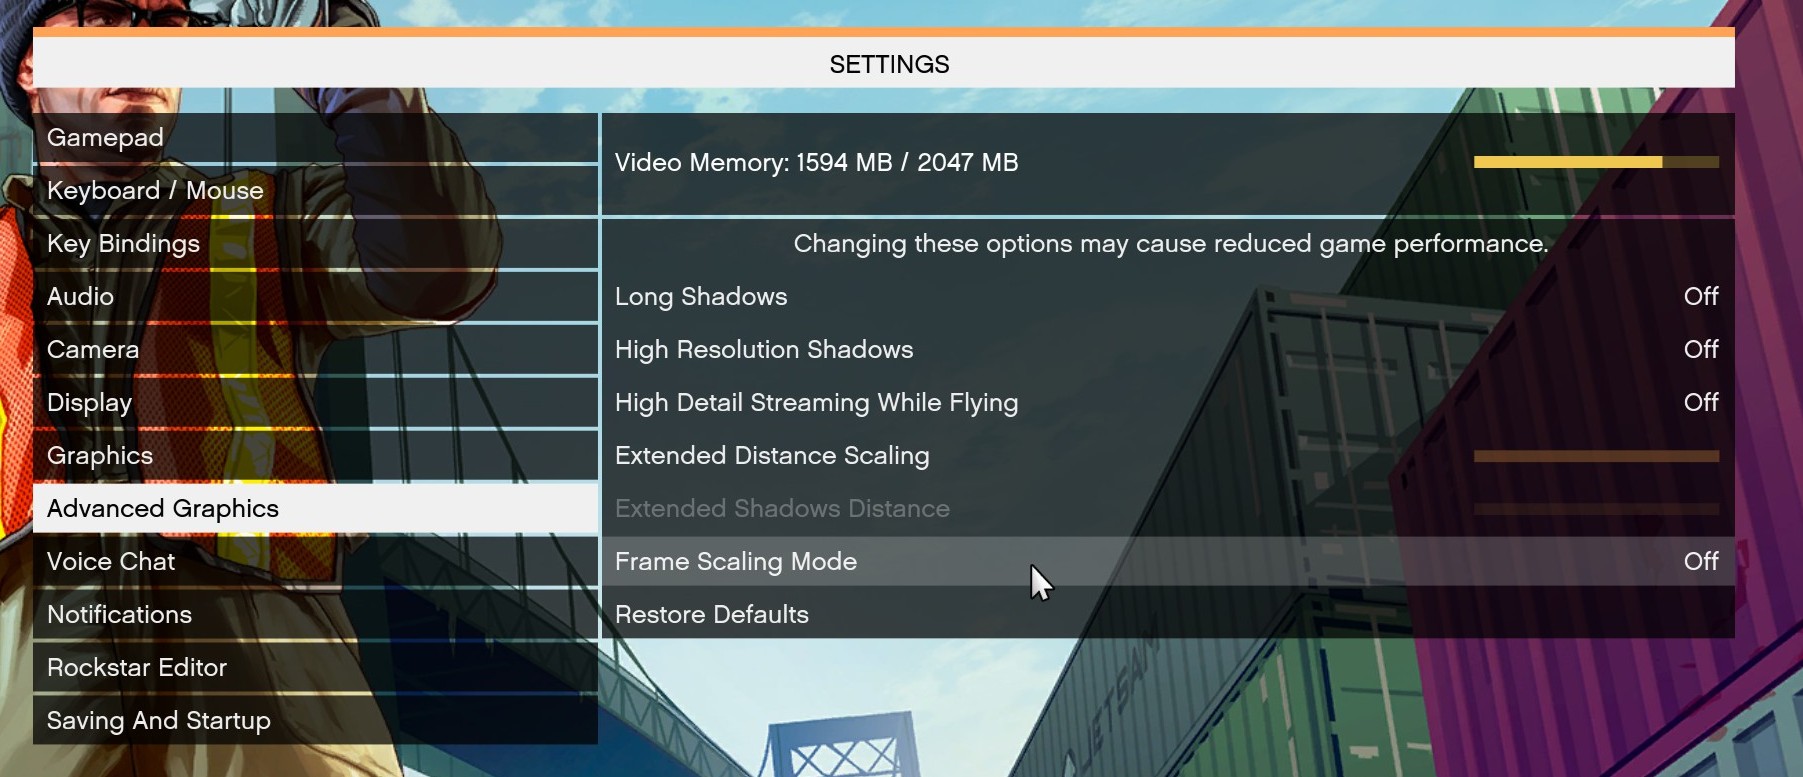
There are no presets for the graphics options on GTA, allowing the user to adjust options such as population density and distance scaling on sliders, but others such as texture/shadow/shader/water quality from Low to Very High. Other options include MSAA, soft shadows, post effects, shadow resolution and extended draw distance options. There is a handy option at the top which shows how much video memory the options are expected to consume, with obvious repercussions if a user requests more video memory than is present on the card (although there’s no obvious indication if you have a low-end GPU with lots of GPU memory, like an R7 240 4GB).
To that end, we run the benchmark at 1920x1080 using an average of Very High on the settings, and also at 4K using High on most of them. We take the average results of four runs, reporting frame rate averages, 99th percentiles, and our time under analysis.
All of our benchmark results can also be found in our benchmark engine, Bench.
MSI GTX 1080 Gaming 8G Performance
1080p
4K
ASUS GTX 1060 Strix 6G Performance
1080p
4K
Sapphire Nitro R9 Fury 4G Performance
1080p
4K
Sapphire Nitro RX 480 8G Performance
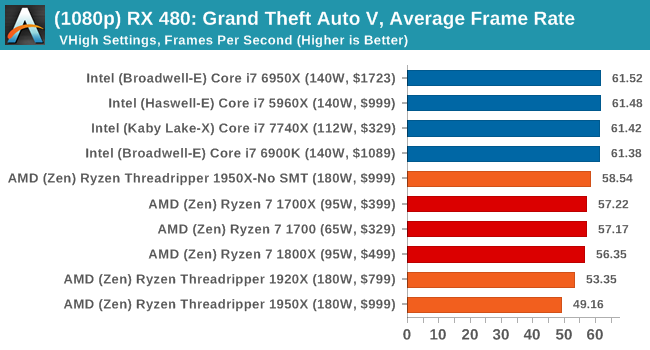
1080p
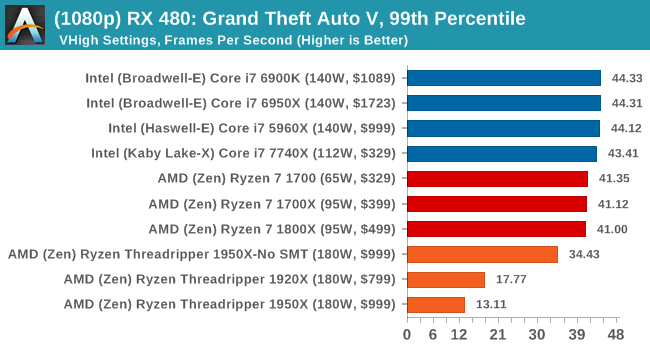
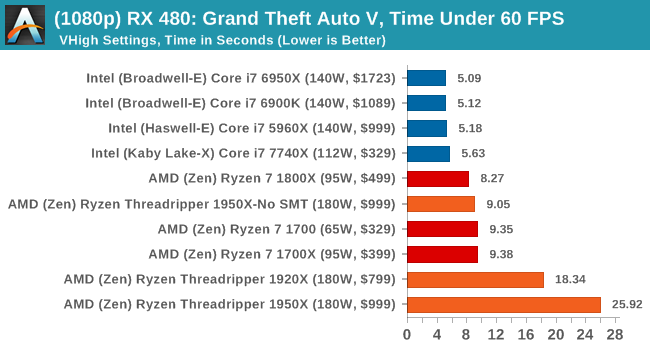
4K
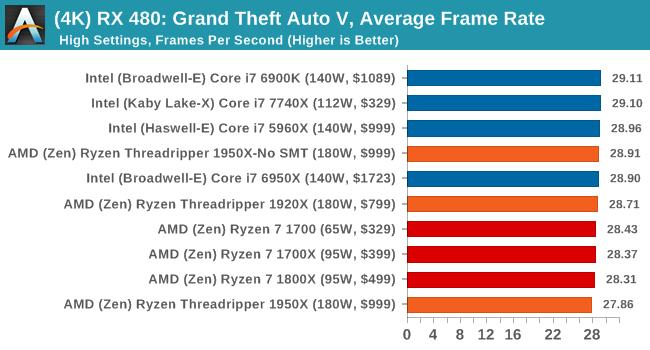
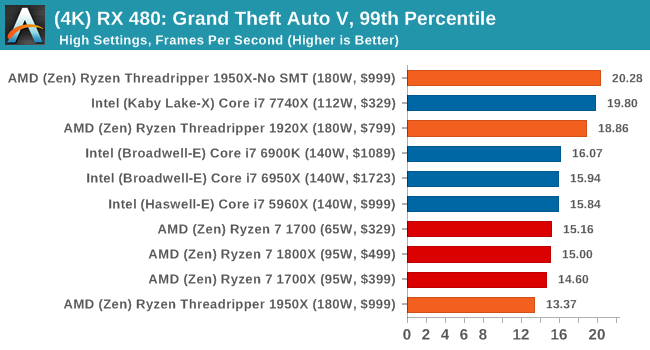
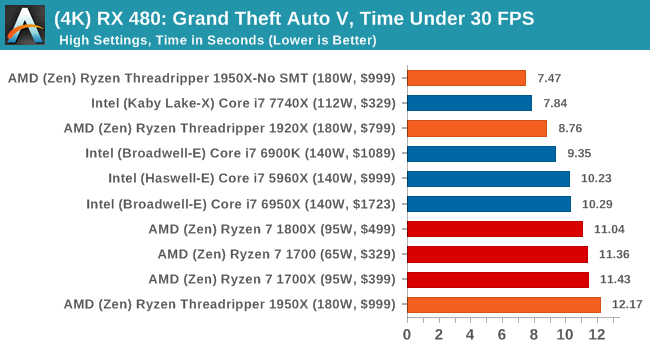
Depending on the CPU, for the most part Threadripper performs near to Ryzen or just below it.
Power Consumption and Distribution
With Threadripper weighing in at a TDP of 180W, it comes across as a big jump from previous AMD platforms that hover at 45-95W, or Intel platforms that are sub-95W for mainstream and up to 140W for the high-end desktop. Let us not forget that AMD actually released a 220W TDP processor in the form of the FX-9590 running at 5 GHz, which was initially sold for 12+ months as a part purely for OEMs and system integrators in order to ensure that users had sufficient cooling. Eventually it was released as a consumer product, bundled with a beefy double width liquid cooler and a pair of fans. AMD sampled us a CPU, not before I went and spent £300 on one myself and reviewed it:
Nonetheless, 180W for AMD isn’t a new concept for TDP. For this review I’ve been using the liquid cooler AMD shipped with our FX-9590 sample, because it was designed to handle at least 220W. (AMD also sampled a 3x120 Thermaltake cooler with Threadripper, which would have taken a lot longer to organise on the test bed.)
For our power testing, we run Prime95 for at least 60 seconds then use software to poll the integrated power counters on the chip to get results. Depending on the CPU, we can get data for the full chip, per core, DRAM, uncore or integrated graphics – it relies on our tool being up to date or the registers for this data to be known. Normally this way of reading the power consumption can be a smidge inaccurate compared to more invasive methods, it is quick and scriptable, and it is this data that governs if and when a CPU is hitting power limits and needs to adjust fan speeds/frequencies to compensate.
To start, let us take the full package power consumption for Threadripper.
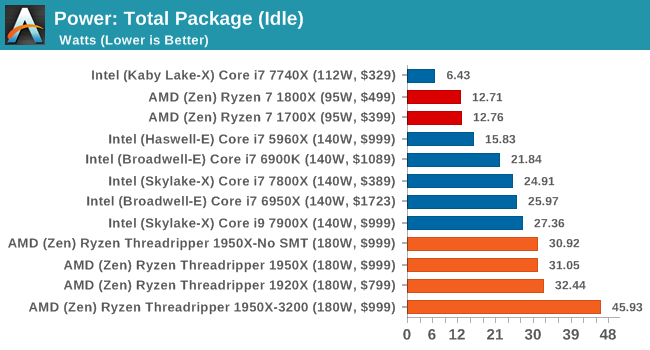
On the whole, Threadripper is a hungry chip even at idle. Most of the power here is being consumed by the memory controller and PCIe bus to keep the GPU ticking over with a static display. The fact that the 1950X running DDR4-3200 memory is pulling another 13W+ from the CPU shows how much of an impact the memory controller has on total power consumption. For all the chips, we’re recording sub 2W power draw from the cores.
When we load up the package with a single thread, it fires up the uncore/mesh as well as the memory and puts the system into its peak turbo state. Depending on the way the CPU is designed, this could fire up a single core or a bank of cores, so although in a bank of cores only one will be doing the work, it can still train power to be noticeable.
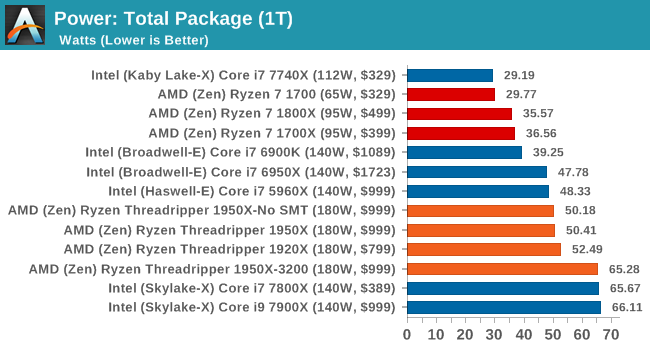
The results show all the Threadripper CPUs again hitting around the same mark, well above the Ryzen CPUs, and matching the 10C/8C parts from Broadwell-E and Haswell-E respectively. The 1950X running DDR4-3200 is still pulling an additional +13W, but interestingly the Skylake-X cores have jumped in power consumption to around this level. It would appear that the MoDe-X interconnect used in Skylake-X can also draw substantial power.
The next test is running the CPU will a full complement of threads for the design of the chip. This usually puts maximum strain on all the cores, the interconnect and the memory controller.
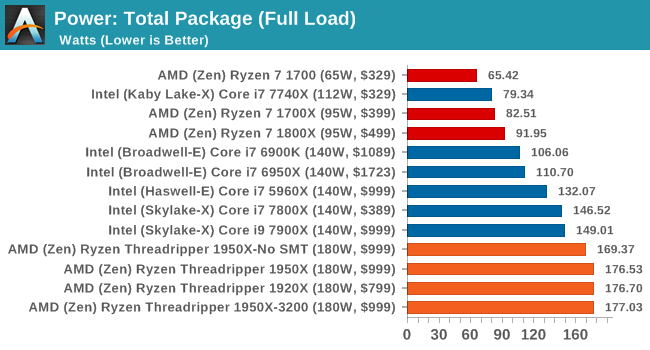
All the Threadripper CPUs hit around 177W, just under the 180W TDP, while the Skylake-X CPUs move to their 140W TDP. The 1950X in Game Mode seems to draw a little less power, which might be due to how the DRAM is being run in a NUMA environment.
One of the other graphs we have for some of the chips is the ‘cores-only’ power draw. At full load, we get an interesting plot:
The key element to this graph is the 1950X running at DDR4-3200. Because the faster DRAM requires the memory controller to draw more power, it leaves less power for the CPU cores, potentially resulting in a lower turbo core frequency. So while the faster memory might guarantee faster performance in memory limited scenarios, the core frequency might end up lower given worse performance overall. It’s an interesting thought, so we plotted the per-core power for the 1950X at DDR4-2400 and DDR4-3200.
In this graph, the core number on the vertical axis is where the power measurement is taken, while from left to right is where we are loading up the cores, two threads at a time.
Initially we see that with two threads being loaded onto one core, that single core is drawing 20.77W. This quickly moves down to 19W, 17W, 16W to 11W by the time that half of the chip is loaded. At this point, with 8 cores loaded, the cores on their own are drawing 89W – if we add in the DRAM controllers, this would certainly be more than a Ryzen CPU. However, as we move past 10 cores loaded, something odd happens – the total power consumption of the cores drops from 120W to 116W to 102W when 24 threads are in play. This is indicated by the second silicon die drawing less power per core. It then ramps up again, with the full chip giving each core about 8.2W.
Moving onto the DDR4-3200 graph shows a similar scenario:
At first, the single core gets a big 21W, although as we load up the cores by the time it hits 4 cores/8 threads, the sub-15W per core at DDR4-3200 is being eclipsed by the 16W per core at DDR4-2400. Moving through we see a small wobble at 24-26 threads again, with the final tally putting only 114W onto the cores, 20W less than at DDR4-2400.
Some of the data for Game Mode did not come through properly, so we can’t draw many conclusions from what we have, although an interesting point should be made. In Game Mode, when a system requires a low number of threads, say anywhere from 2-8, because SMT is disabled these threads need to run on different CCXes. In Creator Mode, these threads would group into 1-4 cores over one CCX, and consume less power. At DDR4-2400, this means 65W in Creator mode for 8 threads (4 cores) compared to 89W in Game mode for 8 cores active.
Analyzing Creator Mode and Game Mode
Way back on page 3, this review explained that AMD was promoting two modes: Creator Mode with all cores enabled and a uniform memory access (UMA) architecture, and Game Mode that disabled one of the dies and adjusted to a non-uniform memory architecture (NUMA). The idea was that in Creator Mode you had all the threads and bandwidth, while Game Mode focused on compatibility with games that freaked out if you had too many cores, but also memory and core-to-core latency by pinning data as close to the core as possible, and keeping related threads all within the same Zeppelin die. Both methods have their positives and negatives, and although they can be enabled through a button press in Ryzen Master and a reboot, most users who care enough about these settings are likely to set it and forget it. (And then notice that if the BIOS resets, so does the settings…)
*This page has been edited on 8/17, due to a misinterpretation in the implementation of Game Mode. This original review has been updated to reflect this. We have written a secondary mini-article with fresh testing on the effects of Game Mode.
Final Thoughts: Do or Do Not - There is no Try
In this review we’ve covered several important topics surrounding CPUs with large numbers of cores: power, frequency, and the need to feed the beast. Running a CPU is like the inverse of a diet – you need to put all the data in to get any data out. The more pi that can be fed in, the better the utilization of what you have under the hood.
AMD and Intel take different approaches to this. We have a multi-die solution compared to a monolithic solution. We have core complexes and Infinity Fabric compared to a MoDe-X based mesh. We have unified memory access compared to non-uniform memory access. Both are going hard against frequency and both are battling against power consumption. AMD supports ECC and more PCIe lanes, while Intel provides a more complete chipset and specialist AVX-512 instructions. Both are competing in the high-end prosumer and workstation markets, promoting high-throughput multi-tasking scenarios as the key to unlocking the potential of their processors.
| The Battle | |||||||||
| Cores/ Threads |
Base/ Turbo |
XFR/ TB |
L3 | DRAM 1DPC |
PCIe | TDP | Cost (8/10) |
||
| AMD | TR 1950X | 16/32 | 3.4/4.0 | +200 | 32 MB | 4x2666 | 60 | 180W | $999 |
| Intel | i9-7900X | 10/20 | 3.3/4.3 | +200 | 13.75 | 4x2666 | 44 | 140W | $980 |
| Intel | i7-6950X | 10/20 | 3.0/3.5 | +500 | 25 MB | 4x2400 | 40 | 140W | $1499 |
| AMD | TR 1920X | 12/24 | 3.5/4.0 | +200 | 32 MB | 4x2666 | 60 | 180W | $799 |
| Intel | i7-7820X | 8/16 | 3.6/4.3 | +200 | 11 MB | 4x2666 | 28 | 140W | $593 |
What most users will see on the specification sheet is this: compared to the Core i9-7900X, the AMD Ryzen Threadripper 1950X has 6 more cores, 16 more PCIe lanes, and ECC support for the same price. Compared to the upcoming sixteen core Core i9-7960X, the Threadripper 1950X still has 16 more PCIe lanes, ECC support, but is now substantially cheaper.
On the side of the 1920X, users will again see more cores, ECC support, and over double the number of PCIe lanes compared to the Core i7-7820X for $100 difference. Simply put, if there is hardware that need PCIe lanes, AMD has the solution.
In our performance benchmarks, there are multiple angles to describe the results we have collected. AMD is still behind when it comes to raw IPC, but plays competitively in frequency. Intel still wins the single threaded tasks, especially those that rely on DRAM latency. AMD pulls ahead when anything needs serious threads by a large amount, and most of the time the memory arrangement is not as much of an Achilles heel as might be portrayed. If a user has a workload that scales, AMD is bringing the cores to help it scale as wide as possible.
Despite Threadripper's design arguably being better tuned to highly threaded workstation-like workloads, the fact that it still has high clocks compared to Ryzen 7 means that gaming is going to be a big part of the equation too. In its default Creative Mode, Threadripper’s gaming performance is middling at best: very few games can use all those threads and the variable DRAM latency means that the cores are sometimes metaphorically tripping over themselves trying to talk to each other and predict when work will be done. To solve this, AMD is offering Game Mode, which cuts the number of cores and focuses memory allocations to the DRAM nearest to the core (at the expense of peak DRAM bandwidth). This has the biggest effect on minimum frame rates rather than average frame rates, and affects 1080p more than 4K, which is perhaps the opposite end of the spectrum to what a top-level enthusiast would be gaming on. In some games, Game Mode makes no difference, while in others it can open up new possibilities. We have a full article on Game Mode here.
If I were to turn around and say that Threadripper CPUs were not pure gaming CPUs, it would annoy a fair lick of the tech audience. The data is there – it’s not the best gaming CPU. But AMD would spin it like this: it allows the user to game, to stream, to watch and to process all at the same time.
You need a lot to do in order to fill 16 cores to the max, and for those that do, it’s a potential winner. For anyone that needs hardcore throughput such as transcode, decode, rendering such as Blender, Cinema 4D or ray-tracing, it’s a great CPU to have. For multi-GPUs or multi-storage aficionados or the part of the crowd that wants to cram a bunch of six PCIe 3.0 x8 FPGAs into a system, AMD has you covered.
Otherwise, as awesome as having 16 cores in a consumer processor is – and for that matter as awesome as the whole Threadripper name is in a 90s hardcore technology kind of way – Threadripper's threads are something of a mixed blessing in consumer workloads. A few well-known workloads can fully saturate the chip – video encoding being the best example – and a number of others can't meaningfully get above a few threads. Some of this has been due to the fact that for the last 8 years, the bread-and-butter of high-end consumer processors have been Intel's quad-core chips. But more than that, pesky Amdahl's Law is never too far away as core counts increase.
The wildcard factor here – and perhaps the area where AMD is treading the most new ground – is in the non-uniform allocation of the cores. NUMA has never been a consumer concern until now, so AMD gets to face the teething issues of that introduction head on. Having multiple modes is a very smart choice, especially since there's a good bit of software out there that isn't fully NUMA-aware, but can fill the CPU if NUMA is taken out of the equation and the CPU is treated as a truly monolithic device. Less enjoyable however is the fact that switching modes requires a reboot; you can have your cake and eat it too thanks to mode switching, but it's a very high friction activity. In the long-term, NUMA-aware code would negate the need for local vs distributed if the code would pin to the lowest latency memory automatically. But in lieu of that, AMD has created the next best thing, as even in an ideal world NUMA is not without its programming challenges, and consequently it's unlikely that every program in the future will pin its own memory correctly.
In that respect, a NUMA-style CPU is currently a bit of a liability in the consumer space, as it's very good for certain extreme workloads but not as well balanced as a single Ryzen. Costs aside, this means that Threadripper isn't always a meaningful performance upgrade over Ryzen. And this isn't a catch unique to AMD – for the longest time, Intel's HEDT products have required choosing between core counts and top-tier single-threaded performance – but the product calculus has become even more complex with Threadripper. There are trade-offs to scaling a CPU to so many cores, and Threadripper bears those costs. So for the consumer market its primarily aimed at, it's more important than ever to consider your planned workloads. Do you need faster Handbrake encoding or smoother gameplay? Can you throw enough cores at Threadripper to keep the beast occupied, or do you only occasionally need more than Ryzen 7's existing 8 cores?
AMD has promised that the socket will live for at least two generations, so Threadripper 2000-series when it comes along should drop straight in after a BIOS update. What makes it interesting is that with the size of the socket and the silicon configuration, AMD could easily make those two ‘dead’ silicon packages into ‘real’ silicon packages, and offer 32 cores. (Although those extra cores would always be polling at far memory speeds).
This is the Core Wars. A point goes to the first chip that calculate the Kessel run in under twelve parsecs.


