The Qualcomm Snapdragon 820 Performance Preview: Meet Kryo
by Ryan Smith & Andrei Frumusanu on December 10, 2015 11:00 AM EST- Posted in
- SoCs
- Snapdragon
- Qualcomm
- Snapdragon 820
CPU Performance: Meet Kryo
To dive right into the heart of matters then, after getting our standard benchmarks out of the way we had enough time left to load up some of our more advanced analysis tools to run on the 820 MDP/S. While Qualcomm has been somewhat forthcoming in the Kryo CPU architecture, they have never been as forward as say ARM (who is in the business of licensing the IP), so there are still some unanswered questions about what Kryo is like under the hood.
| Qualcomm CPU Core Comparison | |||||||
| Snapdragon 800 | Snapdragon 810 | Snapdragon 820 | |||||
| CPU Codename | Krait | ARM Cortex-A57 | Kryo | ||||
| ARM ISA | ARMv7-A (32-bit) | ARMv8-A (32/64-bit) | ARMv8-A (32/64-bit) | ||||
| Integer Add | 1 | 2 | 1 | ||||
| Integer Mul | 1 | 1 | 1 | ||||
| Shifter ALUs | 1 | 2 | 1 | ||||
| Addition (FP32) Latency | 3 cycles | 5 cycles | 3 cycles | ||||
| Multiplication (FP32) Latency | 6 cycles | 5 cycles | 5 cycles | ||||
| Addition (INT) Latency | 1.5 cycles | 1 cycle | 1 cycle | ||||
| Multiplication (INT) Latency | 4 cycles | 3 cycles | 4 cycles | ||||
| L1 Cache | 16KB I$ + 16KB D$ | 48KB I$ + 32KB D$ | 32KB I$ + 32KB D$? | ||||
| L3 Cache | N/A | N/A | N/A | ||||
One thing that immediately jumps out is how similar some of our results are to Krait. According to our initial tests, the number of integer and FP ALUs would appear to be unchanged. Similarly the latency for a lot of operations is similar as well. This isn’t wholly surprising as Krait was a solid architecture for Qualcomm, and there is a good chance they agreed and decided to use it as their starting point. At the same time however I do want to note that these are our initial results done rather quickly on what’s essentially a beta device; further poking later on may reveal more differences than what we’ve seen so far.
But with the above said, there’s a big difference between how many execution units a CPU design has and how well it can fill them, which is why even similar designs can have wildly different IPC. We’ll investigate this a bit more in a moment, however it’s worth noting that this is exactly the philosophy ARM has gone into with Cortex-A72, so it is neither unprecedented nor even unexpected.
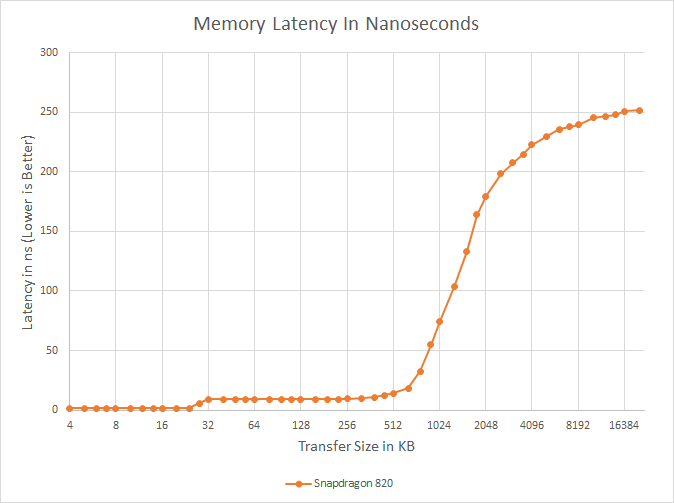
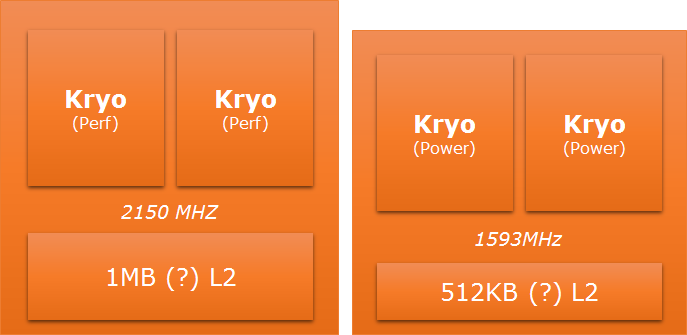
Looking at the memory hierarchy and latency, our results point to a 32KB L1 data cache. For the moment I’m assuming the instruction cache is identical, as is the case on most designs, but this test is purely a data test. Meanwhile L2 cache size is a bit harder to pin down; we know that the different CPU clusters on 820 will be using different L2 cache sizes. Ultimately it's pretty much impossible to pin down the exact L2 cache size from this test alone, especially since we can't see the amount of L2 attached to the lower clocked Kryo cluster.
According to our colleague Matt Humrick over at Tom's Hardware, while investigating the matter, it seems that Qualcomm disclosed that we're looking at an 1MB L2 for the performance cluster and a 512KB L2 for the power cluster. We're still looking into independently confirming this bit of information with Qualcomm.
However what you won’t find – and much to our surprise – is an L3 cache. Our test results indicate (and Qualcomm confirms) that Snapdragon 820 does not have an L3 cache as we initially expected, with the L2 cache being the highest cache level on the chip. We initially reported there to be an L3 due to the fact that we found evidence and references to this cache block in Qualcomm's resources, but it seems the latest revision of the SoC doesn't actually employ such a piece in actual silicon, as demonstrated by the latency graph. This means that there isn’t any kind of cache back-stopping interactions between the two CPU clusters, or between the CPU and GPU. Only simple coherency, and then beyond that main memory.
| Geekbench 3 Memory Bandwidth Comparison (1 thread) | ||||||
| Stream Copy | Stream Scale | Stream Add | Stream Triad | |||
| SD 801 (2458MHz) | 7.6 GB/s | 4.6 GB/s | 4.6 GB/s | 5.2 GB/s | ||
| SD 810 (1958MHz) | 7.5 GB/s | 7.4 GB/s | 6.4 GB/s | 6.6GB/s | ||
| SD 820 (2150MHz) | 17.4 GB/s | 11.5 GB/s | 13.1 GB/s | 12.8 GB/s | ||
| SD 820 > 810 Advantage | 131% | 55% | 103% | 94% | ||
Meanwhile looking at Geekbench 3 memory performance, one can see that memory bandwidth is greatly improved over both Snapdragon 800/801 and 810. Stream copy in particular is through the roof, increasing by 131% (over double 810’s performance). Even the other tests, though not as great, are between 55% and 103%. The Snapdragon 820 also shows improved latency to main memory when compared to the Snapdragon 810, so it seems that Qualcomm made definite improvements in the memory controller and general memory architecture of the chipset, allowing the CPUs to get nearer to the theoretical total memory bandwidth offered by the memory controllers.
Moving on, let’s shift to some benchmarks that make a more comprehensive look at performance, starting with SPECint2000. Developed by the Standard Performance Evaluation Corporation, SPECint2000 is the integer component of their larger SPEC CPU2000 benchmark. Designed around the turn of the century, officially SPEC CPU2000 has been retired for PC processors, but with mobile processors roughly a decade behind their PC counterparts in performance, SPEC CPU2000 is currently a very good fit for the capabilities contemporary SoCs.
| SPECint2000 - Estimated Scores | ||||||
| Snapdragon 810 | Snapdragon 820 | % Advantage | ||||
| 164.gzip |
823
|
1176
|
43%
|
|||
| 175.vpr |
2456
|
1707
|
-30%
|
|||
| 176.gcc |
1341
|
1641
|
22%
|
|||
| 181.mcf |
789
|
593
|
-25%
|
|||
| 186.crafty |
1492
|
1449
|
-3%
|
|||
| 197.parser |
753
|
962
|
28%
|
|||
| 252.eon |
2321
|
3333
|
44%
|
|||
| 253.perlbmk |
1090
|
1384
|
27%
|
|||
| 254.gap |
1325
|
1447
|
9%
|
|||
| 255.vortex |
1043
|
1583
|
52%
|
|||
| 256.bzip2 |
867
|
1041
|
20%
|
|||
| 300.twolf |
DNC
|
DNC
|
N/A
|
|||
Even though this early preview means we don’t have the luxury of building a binary with a compiler aware of Kryo, using our A57 binaries produces some preliminary results on the 820 MDP/S. Performance does regress in a couple of places – but in other places we see performance increases by up to 52%. 820 does have a slight 10% frequency advantage over 810, so when taking into account the clock difference the IPC improvements are slightly lower. This is also showcased when comparing the Snapdragon 820 to a more similarly clocked Exynos 7420 (A57 @ 2100MHz), where the maximum advantage drops to 33% and similarly to a clock-normalized Snapdragon 810, the overall average comes in at only 5-6%. Once we get the opportunity to have more time with a Snapdragon 820 device we'll be able to verify how much the compiler settings affect the score on the Kryo architecture.
Our other set of comparison benchmarks comes from Geekbench 3. Unlike SPECint2000, Geekbench 3 is a mix of integer and floating point workloads, so it will give us a second set of eyes on the integer results along with a take on floating point improvements.
| Geekbench 3 - Integer Performance | ||||||
| Snapdragon 810 | Snapdragon 820 | % Advantage | ||||
| AES ST |
739.7 MB/s
|
700.7 MB/s
|
-5%
|
|||
| AES MT |
3.05 GB/s
|
1.99 GB/s
|
-35%
|
|||
| Twofish ST |
89.8 MB/s
|
102.7 MB/s
|
14%
|
|||
| Twofish MT |
448.5 MB/s
|
345.5 MB/s
|
-23%
|
|||
| SHA1 ST |
628.9 MB/s
|
983 MB/s
|
56%
|
|||
| SHA1 MT |
3.02 GB/s
|
2.84 GB/s
|
-6%
|
|||
| SHA2 ST |
83.5 MB/s
|
134.9 MB/s
|
61%
|
|||
| SHA2 MT |
393.4 MB/s
|
374.6 MB/
|
-5%
|
|||
| BZip2Comp ST |
5.01 MB/s
|
7.29 MB/s
|
45%
|
|||
| BZip2Comp MT |
20.5 MB/s
|
20.5 MB/s
|
0%
|
|||
| Bzip2Decomp ST |
7.99 MB/s
|
9.76 MB/s
|
24%
|
|||
| Bzip2Decomp MT |
30.8 MB/s
|
24.9 MB/s
|
-19%
|
|||
| JPG Comp ST |
18.9 MP/s
|
23.3 MP/s
|
23%
|
|||
| JPG Comp MT |
88.9 MP/s
|
76.7 MP/s
|
-14%
|
|||
| JPG Decomp ST |
41.5 MP/s
|
62.2 MP/s
|
49%
|
|||
| JPG Decomp MT |
182.7 MP/s
|
176.6 MP/s
|
-3%
|
|||
| PNG Comp ST |
1.11 MP/s
|
1.56 MP/s
|
43%
|
|||
| PNG Comp MT |
4.78 MP/s
|
4.61 MP/s
|
-4%
|
|||
| PNG Decomp ST |
17.9 MP/s
|
24.2 MP/s
|
35%
|
|||
| PNG Decomp MT |
94.1 MP/s
|
64.3 MPs
|
-32%
|
|||
| Sobel ST |
53.3 MP/s
|
86.3 MP/s
|
62%
|
|||
| Sobel MT |
248.4 MP/s
|
244.8 MP/s
|
-1%
|
|||
| Lua ST |
1.30 MB/s
|
1.59 MB/s
|
22%
|
|||
| Lua MT |
5.93 MB/s
|
4.5 MB/s
|
-24%
|
|||
| Dijkstra ST |
3.38 Mpairs/s
|
5.52 Mpairs/s
|
63%
|
|||
| Dijkstra MT |
13.7 Mpairs/s
|
13.7 Mpairs/s
|
0%
|
|||
The actual integer performance gains with GeekBench 3 are rather varied. Single-threaded results consistently show gains, ranging from a minor -5% regression for AES up to a 61% improvement for SHA2. Given the architecture shift involved here, this is a bit surprising (and in Qualcomm’s favor) since you wouldn’t necessarily expect Kryo to beat Cortex-A57 on everything. On the other hand MT results typically show a regression, since Snapdragon 810 had a 4+4 big.LITTLE configuration that meant that it had the 4 Cortex-A53 cores contributing to the task, along with the big cores all running at their near-full clockspeed, while Kryo’s second cluster runs at a reduced clockrate. And though one could have a spirited argument about whether single-threaded or multi-threaded performance is more important, I’m firmly on the side of ST for most use cases.
| Geekbench 3 - Floating Point Performance | ||||||
| Snapdragon 810 | Snapdragon 820 | % Advantage | ||||
| BlackScholes ST |
5.46 Mnodes/s
|
12.3 Mnodes/s
|
125%
|
|||
| BlackScholes MT |
25.5 Mnodes/s
|
32.1 Mnodes/s
|
26%
|
|||
| Mandelbrot ST |
1.2 GFLOPS
|
2 GFLOPS
|
67%
|
|||
| Mandelbrot MT |
6.41 GFLOPS
|
6.23 GFLOPS
|
-3%
|
|||
| Sharpen Filter ST |
1.07 GFLOPS
|
2.15 GFLOPS
|
100%
|
|||
| Sharpen Filter MT |
5.02 GFLOPS
|
6.11 GFLOPS
|
22%
|
|||
| Blur Filter ST |
1.27 GFLOPS
|
3.14 GFLOPS
|
147%
|
|||
| Blur Filter MT |
6.14 GFLOPS
|
8.84 GFLOPS
|
44%
|
|||
| SGEMM ST |
2.29 GFLOPS
|
4.09 GFLOPS
|
79%
|
|||
| SGEMM MT |
6.12 GFLOPS
|
9.19 GFLOPS
|
50%
|
|||
| DGEMM ST |
1.05 GFLOPS
|
1.95 GFLOPS
|
85%
|
|||
| DGEMM MT |
2.81 GFLOPS
|
4.53 GFLOPS
|
61%
|
|||
| SFFT ST |
1.25 GFLOPS
|
1.98 GFLOPS
|
58%
|
|||
| SFFT MT |
4.11 GFLOPS
|
5.65 GFLOPS
|
37%
|
|||
| DFFT ST |
1.03 GFLOPS
|
1.68 GFLOPS
|
63%
|
|||
| DFFT MT |
2.97 GFLOPS
|
4.76 GFLOPS
|
60%
|
|||
| N-Body ST |
486.6 Kpairs/s
|
841 Kpairs/s
|
73%
|
|||
| N-Body MT |
1.72 Mpairs/s
|
2.34 Mpairs/s
|
36%
|
|||
| Ray Trace ST |
1.84MP/s
|
2.86 MP/s
|
55%
|
|||
| Ray Trace MT |
8.16 MP/s
|
8.46 MP/s
|
4%
|
|||
GeekBench 3’s floating point results are even more positive for Snapdragon 820. There is only a single performance regression, a -3% in Mandelbrot multi-threaded. Otherwise in both MT and ST workloads, performance is significantly up. This is a prime example of where Kryo is taking better advantage of its execution units than any high-end Qualcomm SoC before it, as even holding steady (or on paper having a slight deficit) it in practice comes out significantly ahead.


146 Comments
View All Comments
Andrei Frumusanu - Thursday, December 10, 2015 - link
> That doesnt just happen automagically ... the app needs to be specifically coded to do that.The app doesn't have to be coded for it. The photo processing part is done in RenderScript by stock Android APIs and that can use the GPU or fall back to the CPU if it fails to do so. Almost all recent Android devices use the GPU. The only time I saw something explicitly fall back to the CPU was on the G4 and it was just a small portion of the test.
jospoortvliet - Saturday, December 12, 2015 - link
This is interesting, perhaps add such information in the article next time?jospoortvliet - Saturday, December 12, 2015 - link
This is interesting, perhaps add such information in the article next time?tuxRoller - Thursday, December 10, 2015 - link
Who cares about die size? Sure, it can affect yield and pricing but it obviously isn't affecting then much and, in the only evaluation that matters, Apple is able to have a CPU that obliterates every other mobile chip AND is and to sustain peak performance.BTW, do you have a link to a kryo device that scores 2.1k on int? All of the ones I've seen are around 1.8k, with their total brought up by their massive memory and fp scores (totals if around 2.5k).
Wilco1 - Saturday, December 12, 2015 - link
820 vs A72 results: http://browser.primatelabs.com/geekbench3/4159755Shadowmaster625 - Thursday, December 10, 2015 - link
I would have liked to have seen a comparison of S810 MDP vs final hardware so we can get some kind of idea of the amount of optimization to expect.Ryan Smith - Thursday, December 10, 2015 - link
S810 MDP/T was a tablet, and S810 suffered badly under 20nm planar. If you want to see how it compares check out our HTC One M9 review, but it wouldn't tell us anything useful about what MDP/S -> retail will look like.cfenton - Thursday, December 10, 2015 - link
This doesn't inspire confidence. 820 looks much better than 810 at ST tasks and worse or equal in MT tasks, which seems like a good trade-off to me. However, seeing the 820 beaten in almost every benchmark by the A9 is troubling. You can't launch a flagship product six months after a competitor that performs worse than that competitor's product. Well, I guess you can, but it doesn't seem like a good move.Even if you rule out the A9, since other manufacturers can't buy those, it's not that much better than Samsung's almost year-old (by the time the 820 is in a product) SoC in the GS6.
tipoo - Thursday, December 10, 2015 - link
I'm curious what will be in the GS7. Another Exynos in the NA market? If they keep the momentum from the last one, they could perhaps punch above the 820 just like they did the 810. Not sure if their custom cores will be ready in time though?
Araa - Thursday, December 10, 2015 - link
To be frank, same thing has been happening since the A7 (even the A6). Problem is back then they used to cheat on Benchmarks or only show us bs Benchmarks like Antutu that only care about the number of cores so the numbers lied back then, they do now too just not as outrageous as before...