Investigations into Socket 939 Athlon 64 Overclocking
by Jarred Walton on October 3, 2005 4:35 PM EST- Posted in
- CPUs
Synthetic Gaming Performance
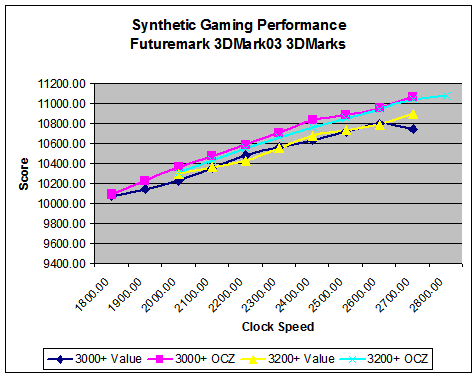
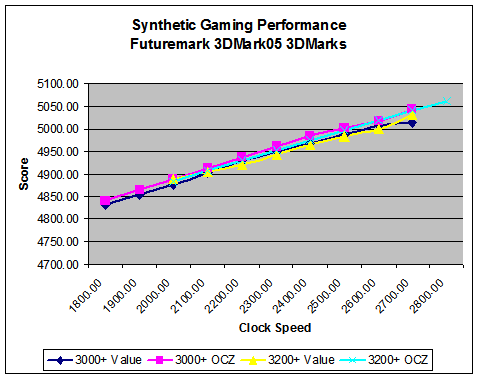
We've already looked at some Futuremark performance numbers, and most people are already familiar with 3DMark. You'll note that we list 3DMark as a Synthetic Gaming benchmark. This is not meant as a slam on the application, but the truth is that games and graphics are so complex these days that the only thing that any benchmark can really tell you is how well that benchmark runs. Doom 3 says nothing about how Quake 4 will actually run on the same system; we'd assume it will be similar, but we won't know until it comes out and we can test it. If a game can't even give you sure knowledge of how other licensees of the engine will run, how can it possibly give you an insight into how a different engine will run? That's 3DMark in a nutshell: some games will correlate very well with the performance results and scaling that we see in 3DMark, and others will be completely different. The only thing that the benchmark shows for sure is how well it runs.
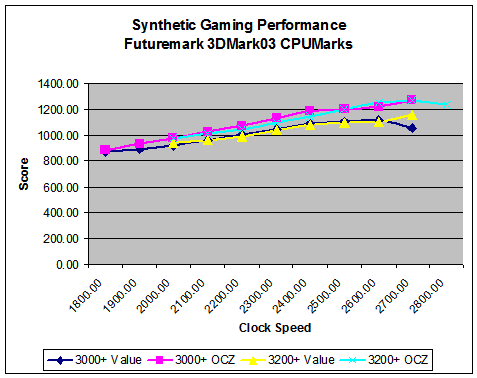
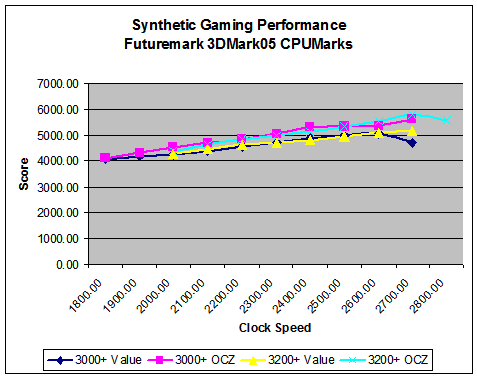
The good news is that we also get CPUMarks that largely remove the graphics card from the picture. The CPUMarks render a couple of the same tests as the 3DMarks portions of the tests, but they compute the transform and lighting operations and some other areas on the CPU rather than the GPU. The CPU tests are also multi-threaded, but the Venice chips don't gain anything from that. (If we were to compare the results with a Pentium 4 HT, the P4 tends to perform very well relative to actual gaming results.) The CPU scores are more in line with the other results that we've already seen, gaining 46% and 42% in 03 and 05, respectively.
Being able to run the entire 3DMarks03/05 tests from start to finish without crashing is once again a good indication of stability. We went a step further and looped the tests for eight hours or more on the top overclocks, without trouble... at least, without incident on everything 2700 MHz and below. The 2800 MHz overclock would crash after 30 to 60 minutes of looping, usually during the CPU portion of the test.
We've already looked at some Futuremark performance numbers, and most people are already familiar with 3DMark. You'll note that we list 3DMark as a Synthetic Gaming benchmark. This is not meant as a slam on the application, but the truth is that games and graphics are so complex these days that the only thing that any benchmark can really tell you is how well that benchmark runs. Doom 3 says nothing about how Quake 4 will actually run on the same system; we'd assume it will be similar, but we won't know until it comes out and we can test it. If a game can't even give you sure knowledge of how other licensees of the engine will run, how can it possibly give you an insight into how a different engine will run? That's 3DMark in a nutshell: some games will correlate very well with the performance results and scaling that we see in 3DMark, and others will be completely different. The only thing that the benchmark shows for sure is how well it runs.
The good news is that we also get CPUMarks that largely remove the graphics card from the picture. The CPUMarks render a couple of the same tests as the 3DMarks portions of the tests, but they compute the transform and lighting operations and some other areas on the CPU rather than the GPU. The CPU tests are also multi-threaded, but the Venice chips don't gain anything from that. (If we were to compare the results with a Pentium 4 HT, the P4 tends to perform very well relative to actual gaming results.) The CPU scores are more in line with the other results that we've already seen, gaining 46% and 42% in 03 and 05, respectively.
Being able to run the entire 3DMarks03/05 tests from start to finish without crashing is once again a good indication of stability. We went a step further and looped the tests for eight hours or more on the top overclocks, without trouble... at least, without incident on everything 2700 MHz and below. The 2800 MHz overclock would crash after 30 to 60 minutes of looping, usually during the CPU portion of the test.


101 Comments
View All Comments
DonTrowbridg3 - Thursday, October 4, 2018 - link
2018 checking in. Thanks for all the info and comments. Very helpful in overclocking my FX-60, A8N32-SLI, dual 8800 GTX